As summer blockbuster season extends into April, encompasses more of the globe, and commands ever-increasing budgets, it gets harder to say what the biggest box office performer of all time (OF ALL TIME) is. Tentpole pictures are expected to gross hundreds of millions in the U.S., if not a billion dollars worldwide. But do these astronomical figures mean we’re living in a new era of superstar cinema?
Savvy observers will note that box office grosses should be adjusted for inflation – the diminishing purchasing power of the U.S. dollar. Sure, The Dark Knight Rises pulled in $448MM in U.S. theater receipts, and that’s very impressive. But $448MM in 2012 dollars is only worth $255MM in 1990 dollars. Home Alone ($285MM in 1990 dollars) blows right by it. I guess Macaulay Culkin has more star power than Christian Bale when purchasing parity is taken into account.
So we know that we need to adjust for inflation to get a more accurate picture of the true blockbuster.
Looking back over the last 30 years (1986-2015), a clear winner emerges:
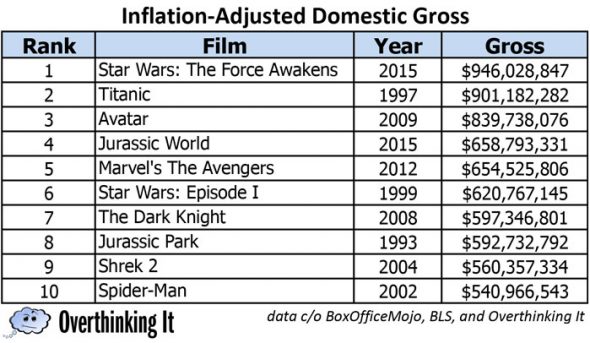
(NOTE: I only looked at the top 10 movies from each year. It’s possible that the #12 movie of 1989 – The War of the Roses – might throw this data off, but it seems unlikely. I also only went back 30 years because it’s a nice round number, it takes us to the era of such beloved blockbusters as Top Gun and Aliens, and because data prior to that is harder to verify.)
So far, all names we’d recognize. No huge surprises. But what other variables should we account for?
Between 1986 and 2015, the population of America grew from 240 million to 321 million. If a movie grossed the same amount – adjusting for inflation – in 1986 and 2015, it makes sense to say that the 1986 movie was a “stronger” performer. There were 25% fewer people in the U.S. in 1986, after all. For that number of people to generate the same revenue, a greater share of them must have seen the movie.
So we re-ran the data accounting for inflation and population (sources for population data include this website). And what did we find?
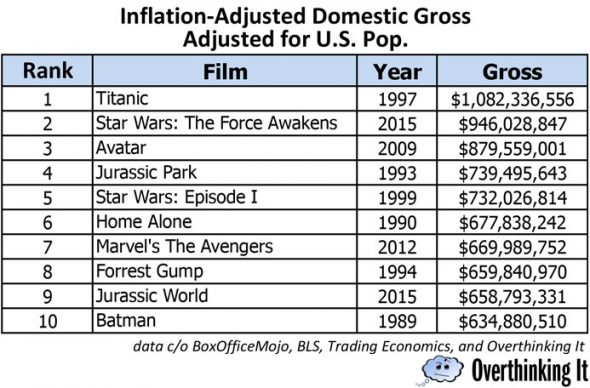
The #1 and #2 movies swap places, as do the two Jurassic Park entries on this list (give or take a rank). The Dark Knight falls off the list, to be replaced by Batman. Avatar is still #3!
Surprisingly, Forrest Gump and Home Alone vault into the ranking. This may be more a function of age than of changing population dynamics. It’s hard to imagine a family-friendly drama or a moving prestige picture drawing the same box office in 2016 as it would have in 1990. If Forrest Gump came out today, it feels like the kind of movie I’d wait to see on Netflix, but Star Wars: The Force Awakens is best consumed on the big screen.
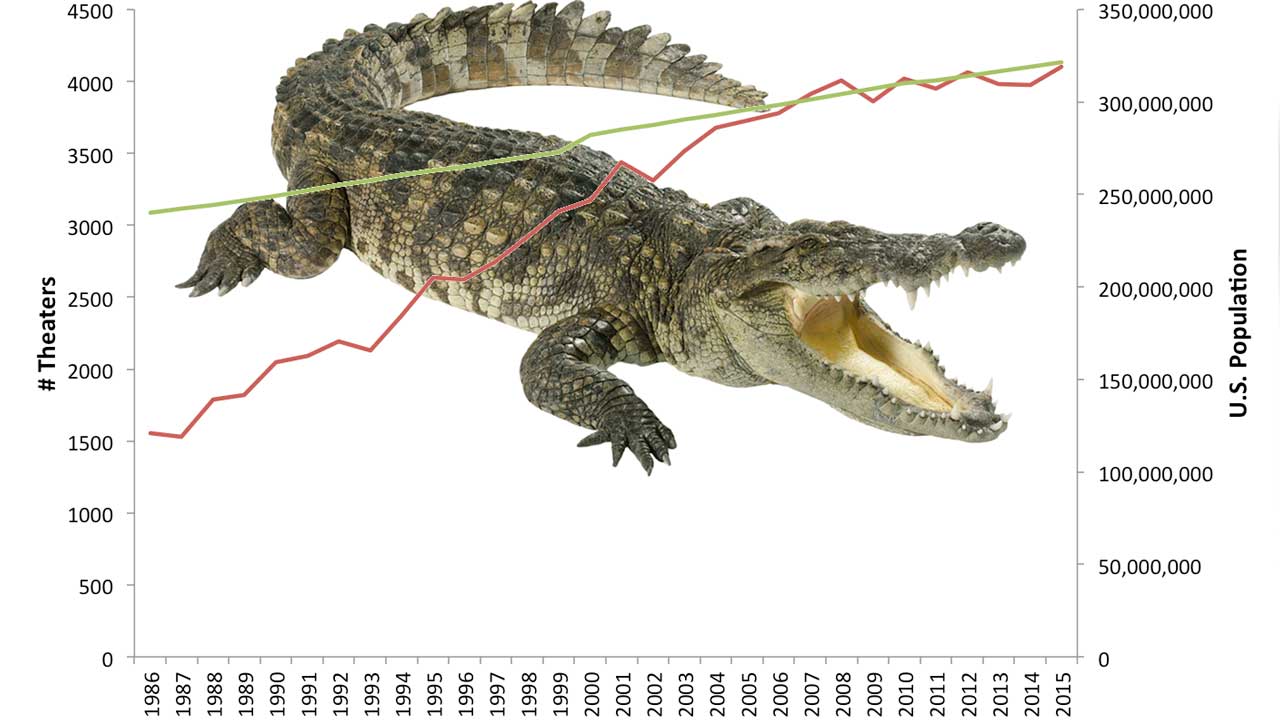
But that’s not all that’s changed! The American cinema marketplace has expanded as well. Regional theaters have been consolidated into national chains, and multiplexes have become megaplexes. The #1 movie of 1986 (Top Gun) opened on 1,531 screens; the #1 movie of 2015 (SW:TFA) opened on 4,134.
This obviously weights box office totals unfairly in favor of the modern era. A movie that earned $100MM on 2000 screens obviously did better than a movie that earned $100MM on 4000. And we won’t let this data rest until we find a true winner!
So I re-re-ran the data, controlling for inflation, population, and the number of theaters a movie ran in (data again c/o BoxOfficeMojo). And this time, the rankings are really surprising.
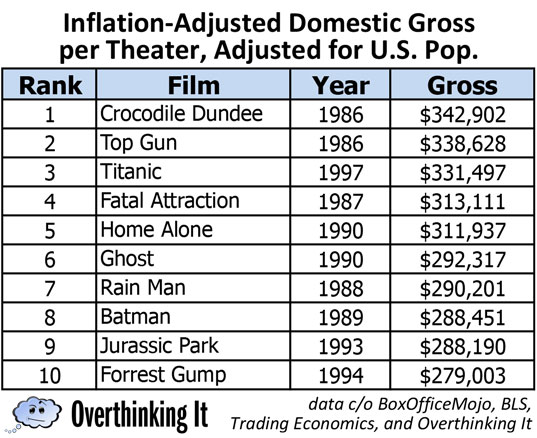
That is not a typo. Controlling for inflation, population, and the number of theaters it appeared in, Crocodile Dundee is the highest-grossing movie of the last 30 years. This defies my capacity as an amateur data journalist to explain. Was 1986 that dull a year for all other forms of media that people packed out the 1,495 theaters that Crocodile Dundee was showing in? Was Australia that exotic to jaded American tastes? Was the movie better than I remember?
The predominance of pre-2000 movies in this new ranking makes me worry about my method. Maybe controlling for number of theaters and population is too much. The number of theaters in the U.S. should correlate somewhat with population – Loews wouldn’t build more screens unless they thought there were more asses to put in seats.
So I took the average number of theaters that the top 10 movies of a given year appeared in, and graphed it against U.S. population by year. As I discovered, there’s a very tight correlation – from about 2003 onward.
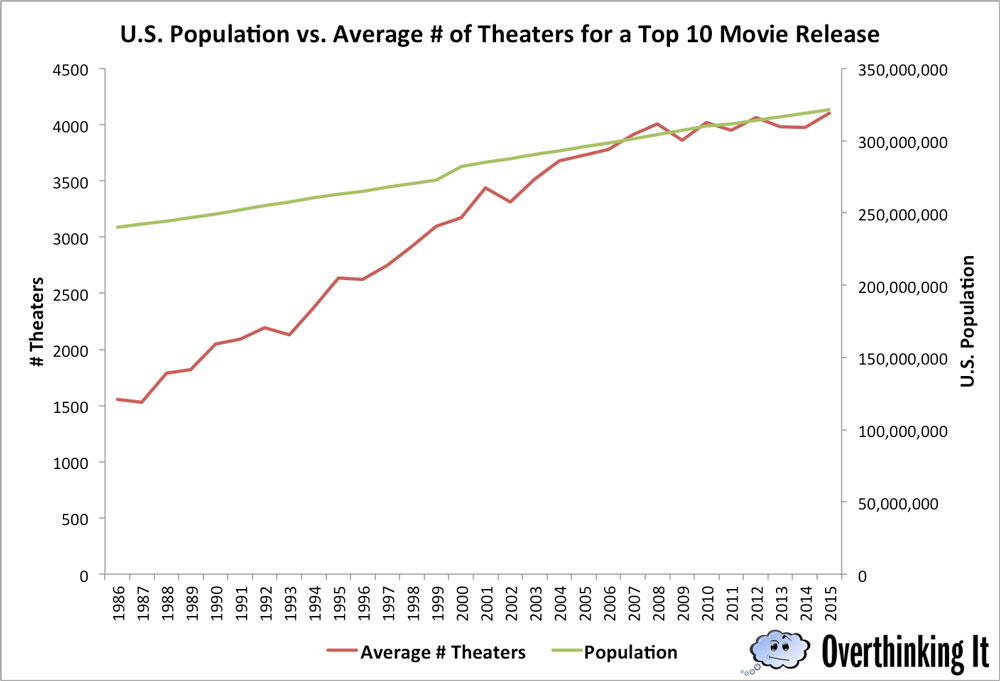
The number of theaters almost works as a stand-in for GDP at the time. Many downticks correspond to recessions – 1991-1992 (off the tail-end of the early 90s recession), 2000-01 (the dot-com bubble bursting), 2007-08 (the latest recession).
What interests me more, though, is the huge gap between population and theaters between 1986 and 2003. Having grown up in the Eighties, I don’t recall feeling particularly underserved. It wasn’t hard to see the biggest releases, even though they appeared on fewer than half as many screens as they do today. But then, I was a child and my ability to see movies was contingent on my parents’ availability and willingness.
It’s also worth noting that movies stayed in theaters longer in the Eighties than they do today, and that the pressure is on to keep shrinking this window. If you didn’t see Crocodile Dundee in its first week, you could have easily seen it in its twelfth.
So while gross per theater, adjusted by population, is an interesting metric, I’m not sure it’s a useful one. The American cinema landscape changed drastically in the 21st century, so there’s no easy comparison to the years prior. It’s no longer apples to apples, so I can’t stand by the conclusions with as much conviction. Sorry, Paul Hogan! You’re still a superstar to me!

G’day.
So there are many different ways to examine this data, and I don’t know if an obvious winning methodology emerges. I’ve made the data available on Google Drive, so pivot it, slice it, or add your own spin on it. If you find something that I missed, let us know!
I’d suggest going back another 10 years if you can, basically to Jaws and the dawn of the Blockbuster. I bet it would be pretty interesting, especially given our late 70s GDP…
As I read this, I had the thought that you might also want to control for number of films released. Either in the same year, month, week, or some other period. This speaks to some of the issues regarding comparing television rating over time. Where there are only four broadcast networks, each show on the air should be netting approx. 25% of the audience. But when there are four broadcast networks, a bunch of cable networks, and streaming options, 25% of the total audience would be an immense success! The impression I have is that more films are being released today as well, giving theater-goers more options.
Not sure how to do that, of course. But it’s what popped into my head.
Don’t forget that, while the number of screens has increased, number of seats per theater has decreased. Gone are the days 1000 seat movie houses in favor of the 100-200 (or less) recliner seat mega multiplex. Instead of screens, I’d like to see the data account for seat inflation vs tickets sold, if available.
A more interesting comparison would be the number of tickets sold, which is a better marker of popularity than box office grosses. Far fewer people go to see movies these days, and the number has been dropping since about 1968.
Does the data have any way of differentiating by cost of add-ons (such as 3-D or IMax?). Adjusting for inflation is a good first step, but it still seems unfair that Avatar is considered a bigger hit than The Dark Knight just because I paid $18 for my ticket to the former and $9 for the latter.
If think that the power of a particular film is measured in dollars earned then the inflation adjusted figures you mention at the top of the article should be the only metric you really need. I believe Gone With the Wind is still the all time winner on that score.
If, however, you feel that the important thing to know is how many people saw a particular movie (its cultural impact) then you need to know how many tickets were sold, how many of those were unique ticket holders as well as how many people saw the movie multiple times. These numbers as a percentage of the total population at the time of release would give a pretty good idea of the impact of a specific movie (I believe).
You would also have to make sure that you account for movies that get re-released years after they originally came out as the population would have changed.
If you want a holistic view, then you would also have to include the number of people who saw the movie after its cinema run finished and didn’t see it at the movies. VHS, DVD, TV, etc.
How you handle multiple viewings would also be a tricky thing to analyze.
Do you give a movie more weight because more people have seen it multiple times (across multiple platforms) or do you put a higher priority on unique views?
I don’t imagine that unique views would be a particularly easy metric to source (probably impossible to get an accurate figure), especially if you try to figure out how many people saw it on TV.
The best you could probably do is look at the number of tickets sold at time of release (and re-released) versus total population. Combined with the number of DVDs, tapes, downloads, etc. purchased/downloaded/watched per year versus total population. This would likely give you the best approximation of how many people actually saw the movie in question. In my mind, that would be the only way you could truly get a real understanding of the all time “champ.”
I think we need a mathematician/statistician and a much larger data-set to get to the bottom of this one!
A possibly interesting structure for your data might be to take the data you have collected and sort movies by genre to see if there are clear types of movies that consistently perform better than others. Lots of people on the internet are doing this type of analysis to talk about why so many sequels.
Maybe another line of attack could be budget v. gross, basically looking at return on investment. Not only what is most popular, but what is most profitable. In that one, inflation takes care of itself, because the cost of making it and the earnings happen just about at the same time.
Personally, I miss the days when only the accountants cared about a movie’s box office take….. The amount of money a movie makes on a weekend is NOT an indicator of quality.
The best way to do, imo, is to calculate the films on return on investment; this will get you a single solid number for each film, that can be directly compared to each other without any more modification.
It’s also the number the studios care the most about.
Going from that, roughly, I had estimated the ROI on several top films a few years back for another project, and noted the top three films of all time are:
Batman (original): 975
Star Wars episode IV: 705.4
Marvel’s the Avengers: 473
note my list wasn’t exhaustive, I was doing more ‘huge hits’ but something more elaborate could be easily done
Planet Money did a lot of great work on this about a year ago:
http://www.npr.org/sections/money/2015/08/21/433505958/horror-is-the-best-deal-in-hollywood
I’d love to see a year by year ROI breakdown of all movies going back to the first silent movies to see whether it was more profitable to make movies in the past or if it is more profitable now.