At Overthinking It, Law & Order is analyzed by two separate yet equally important groups: the people who watch the show and send in the data, and the people who build the spreadsheets. These are their findings…

So when I unveiled the Law & Order Database a couple weeks ago, I focused on one particular graph:
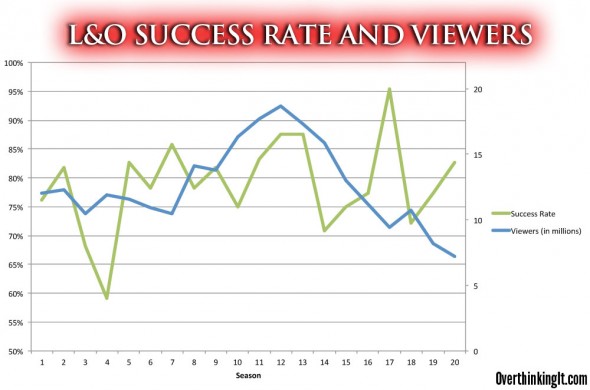
The “Success Rate” is a measure of whether the episode felt like a win or a loss. It’s basically Guilty verdicts + Plea Bargains + Implied Wins. I was focusing on season 17, when the Success Rate spiked to almost 100%. This also happened to be a year when the ratings were at an all-time low, and the show was widely expected to get cancelled. When it looks like the end is near, sometimes a showrunner will do desperate things.
But the more I looked at that graph, the more I realized that those two lines don’t really match up that well. I started to dream of two lines, following each other up in down in lockstep. Sure, deep down we all know that there’s a hundred different factors that determined Law & Order’s storylines… but what if there was just one? What if the series was a giant Magic Eye poster: it looks random at first, but step back and squint just right…
The most obvious connection would be with the real life New York murder rate. But that pretty much goes straight down. Then I tried charting the percent change in the murder rate from year to year, but those lines are going in opposite directions from seasons 5-10.
Hollywood box office, adjusted for inflation? Doesn’t map to either the low point in season 4 or the high point in season 17.
What about if the show outcomes were tied to the number of wins the New York Yankees earned that year? But nope, don’t see anything there. So what about the number of LOSSES the New York Knicks racked up? It’s definitely closer, but not great.
I tried to think of something that spiked in 2006, but drew a blank. My best theory was that Law & Order was somehow predicting the unemployment rate two years later.
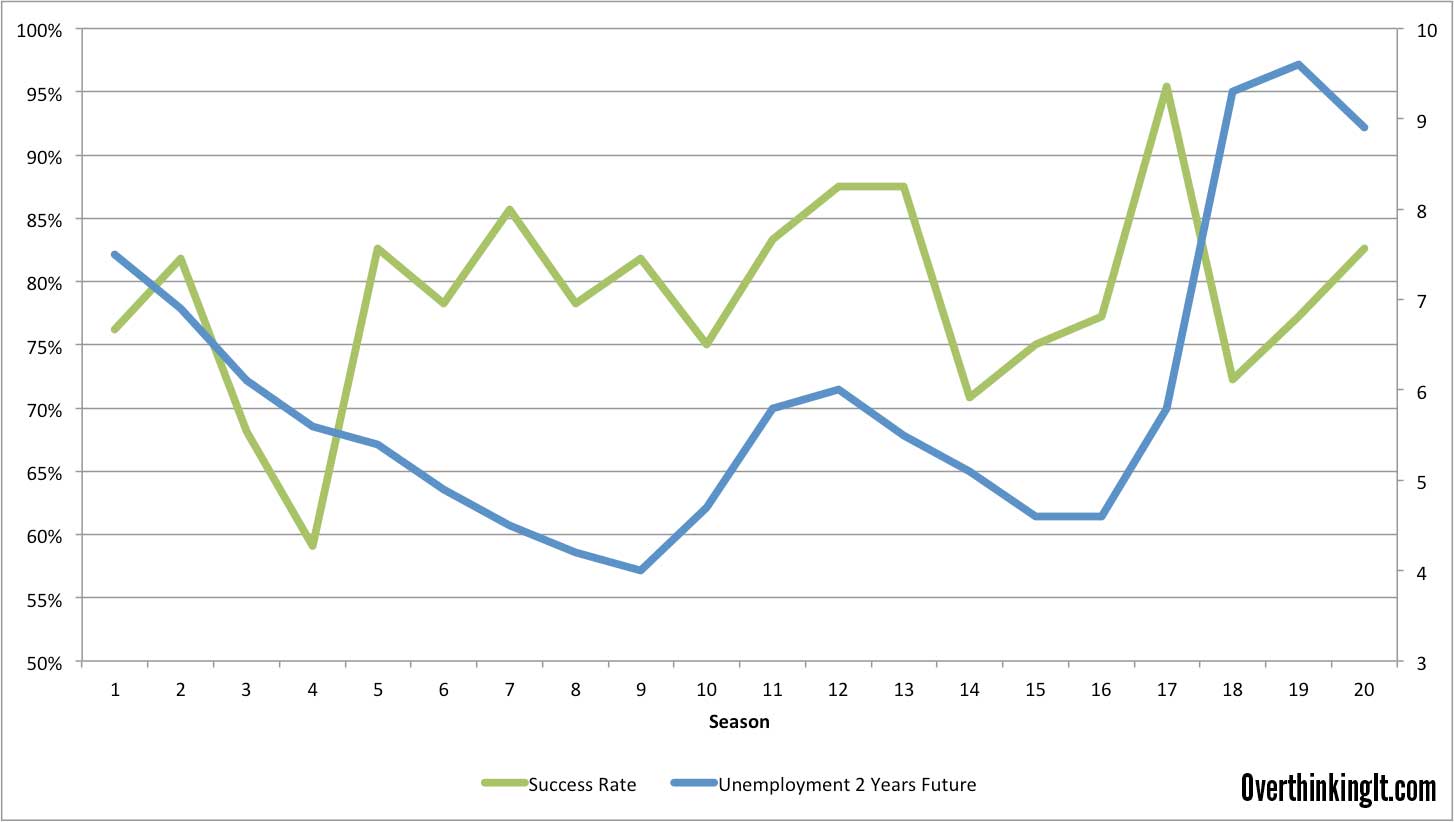
There’s a match for that hump around season 12, and the big spike around season 17. But on the unemployment side, that’s not so much a spike as a devastatingly long slope that stretches into the present day. More importantly, we don’t see anything to match the dip and recovery of the Success Rate around season 4. Unemployment just heads down for almost 10 years. Overall, it’s hard to call that a strong correlation.
However, now I was thinking about the economy, and I had a new theory. Maybe the better people feel about the economy, the more successful the prosecutors on Law & Order became. Maybe the important thing about season 17 wasn’t that the Success Rate went up; it was that it immediately plummeted in season 18. That season premiered on January 2, 2008, right as the world’s economy was beginning to unravel.
I found a spreadsheet with month-by-month data for United States Consumer Confidence, which I then averaged to get annual numbers for 1990 through 2009. The consumer confidence index is supposed to gauge how optimistic people are feeling about the economy, which is almost the same as how optimistic people are feeling about the state of the world in general. I matched up each Law & Order season with the data for the year it began in. The results were pretty damn cool.
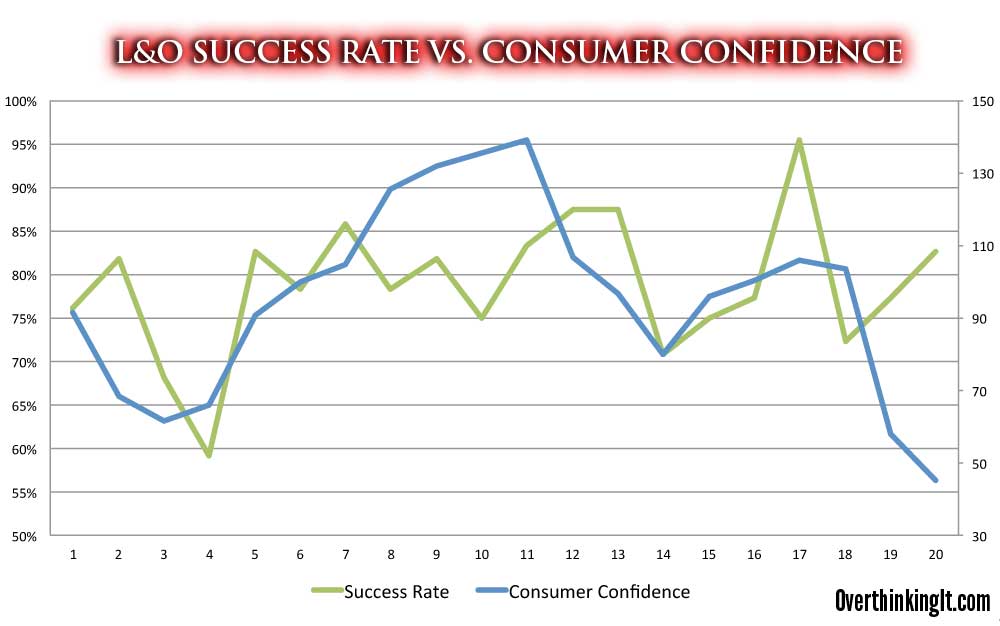
The basic shapes are in sync. You’ve got that first drop around season 4, a peak around season 12, another drop in season 14, the peak in season 17, and then the freefall as the world goes to hell. The biggest divergence is actually right at the very end , when the success rate swoops back up and consumer confidence stays in the dumps. But since I happen to really like this graph, I’m going to propose that maybe breaking the pattern was the very thing that did the show in. As we can see, for most of its run the aggregate tone mirrored what was out there in the zeitgeist. But as the economy crashed in 2008, Law & Order decided that viewers wanted happy endings. Instead, they changed the channel for good, and the cast joined millions of other Americans on unemployment.
But thinking about those last couple seasons gave me one more idea. Can you think of something that dropped dramatically in 2008, but then immediately started to rebound?
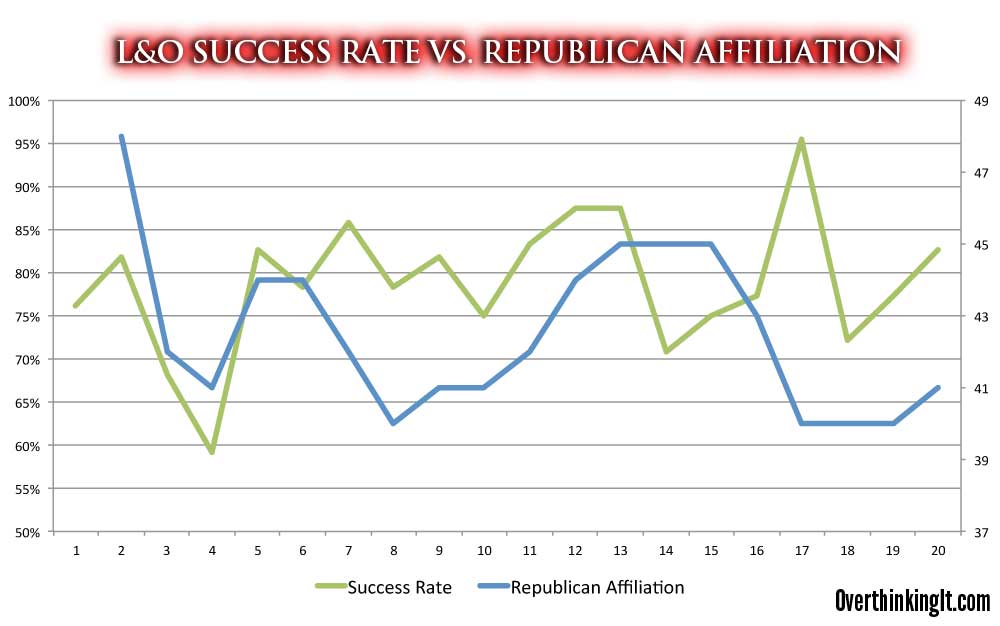
What you’re looking at here is the percentage of people who self-identified as Republicans or Republican-leaning, according to Gallup. This makes me see the show in a whole different way. Season 4 was the lowest Success Rate ever. It premiered only eight months after the inauguration of Bill Clinton. On the other hand, after Bush was reelected, the success rate in season 16 started to go up. Season 18, which followed the democratic landslide election of 2006, saw a huge Success Rate drop. But in the last couple of seasons the Tea Party gained momentum, and the SR inched up.
By the way, Dick Wolf is a Republican.
So what do I personally believe is going on? Well, I think the Republican affiliation chart is a fun conspiracy theory, but consumer confidence is a much better match to my eyes. Plus, the connection makes total sense to me. Any good TV show captures something about its time and place, either by design or simply because good writers can’t help it. I don’t think the producers of Law & Order studied consumer confidence before they decided what stories to greenlight, but I do think they had a sense of whether people were feeling nervous or confident about the state of the world. If it was a time of economic woe, the writers and producers were going to lean (slightly) towards stories that reflected that pessimism. Maybe that’s true of any show, but I wouldn’t be surprised if it’s more true of Law & Order. At its core, the series was about fairness; is the social contract still in force? If people’s life savings are disappearing, they have a higher tolerance for the episodes where the deck is rigged and the good guys don’t stand a chance.
I doubt if anyone working for Law & Order consciously knew they were doing this. But if Dick Wolf and the gang saw this chart (and I hope they do), I think they’d smile and pat themselves on the back that over the course of hundreds of episodes, they managed to roughly track the national mood. That may not have been the secret of the show’s success (which is obviously Lenny’s wisecracks) but maybe it’s a cool side-effect of having savvy producers at the helm.
Okay guys, that’s it for the L&O Database… for now. There are some other variables I’d love to track. For instance:
- Race of defendant/defense attorney
- Sex of defendant/defense attorney
- Class/income of defendant. This is what I’m most curious about, because one of the show’s most consistent themes is how evil rich people are. Maybe some of this is driven by narrative concerns, since rich people are the ones who can afford the fancy lawyers and legal tricks that the show delights in. Still, whenever you saw some icy society lady who deigned to answer the detectives’ questions in between her black tie charity events, you just knew it was her.
So maybe this case isn’t closed after all. Check back with me in two years.
Chung-CHUNG.
My officemate and I are laughing it up right now. Y’all make my world so much more delightful. It’s echoing through the halls of our building. Y’all make our lives so much more delightful.
Oops, I need to learn to edit, don’t I?
(It’s because I was laughing so hard with him)
Hi, Gab’s office mate here.
We should also look at voter turnout. Maybe people turn out to vote more when they see that justice is served in L&O. Or perhaps attitudes towards the Justice System? [1]
Mutz, D.C., and Nir, L. (2011). Not Necessarily the News: Does Fictional Television Influence Real-World Policy Preferences? Mass Communications and Society 13 (2): 196-217
I found the Republican data to be interesting, and maybe a touch more credible of a correlation than the author of this post lets on.
I find that the view of crime and justice in Law and Order to lean Republican most of the time. As the writer mentions, rich people are usually portrayed as pretty evil, but racism and class discrimination seems to be more often used as a cover story for violent psychopaths to get away with crime than the exculpatory factor it would probably be on a more liberal-leaning show.
The storyline is also often more focused on a punishment-centric view of fairness (as in, making sure the bad guy pays) than a rehabilitation-centric view (as in, how do we make sure that, societally, this doesn’t happen again?)
Love the data, and the thought process it evokes. I found this on reddit, and now I’m totally subscribing to your blog :)
I ran the correlation numbers on the Republicans and the Consumer Confidence index. CCI had a 0.17 correlation with success rate, Republican affiliation was -.08. Those are pretty low.
The interesting one is the correlation between RANK and consumer confidence: -0.647. This means that as confidence increased the rank number decreased (or the show got more popular when we felt better.) The correlation with number of viewers is slightly less strong at 0.44 but still matches the overall trend. Confident Americans watch more L&O.
When you state a near 100% clearance rate and 35% success rate (over 80% including other categories), that only refers to cases we see on tv.
There are several episodes that reference to all the cases the detectives and ADA have ongoing. The images of their desks and all the stuff happening in the background demonstrates the cases highlighted on the show don’t reflect the full caseload they are clearing.
I’ve been recovering from a major surgery so pretty much the only watchable show on live tv during the day is the 5 channels that play L & O. Its TV but I always looked at it as the cases presented only reflect a small portion of what the detectives and DA’s office works with. So yes, there is 100% clearance for cases shown but that number could be far lower in their TV reality.
Joe Kenda, Homicide Detective claims a 91% homicide success rate. And that’s supposedly from his actual career.
My biggest issue with the accuracy of the show (other than characters who played criminals only later to play cops or lawyers) is the fact that in closing arguments, the prosecution always went second; or the defendant went first.
My understanding of criminal law in NYC is that the prosecution gives their summation first then the defense can give theirs and choose if they want to address parts of the prosecutions summation. For theatrical effect, it appears they always let Ben, Jack and Cutter make their case last, when the case actually went to closing arguments.
Otherwise good & hillarious points. I’m glad someone out there is overthinking it.
I’m not a lawyer (but I played one in mock trial for 7 years) and I’m not from New York (Iowa), but the structure we used in middle school and high school mock trial, which was supposedly modeled on how actual courts work, was that the prosecution made a closing argument, the defense made a closing argument that could address the arguments prosecution made, and then prosecution had the option to make a final rebuttal, which was the final “last word” of the case. According to this link from the bar association, that seems to be the case in real courts as well. http://www.americanbar.org/groups/public_education/resources/law_related_education_network/how_courts_work/closingarguments.html
Although not equal in quantity how about a comparison in wins and losses between EADAs Ben Stone, Jack McCoy, and Michael Cutter?
I’ve been watching various L&O marathons and when it comes to the last 3 seasons seems to me Cutter lost more cases than Ben Stone and more than Jack in his 15+ seasons as EADA. Not to mention some episodes where they realize they didn’t get the real killer or couldn’t catch another newly discovered killer. Found it a bit strange.
Cool…but who had a better success rate…Stone or McCoy? I know that you have to compensate because McCoy had more cases…but….
There is a lot of great information about the show. Thanks to all involved in making this happen. I found this article by trying to find out how many victims were specifically found in Central Park season 1 to 20. Also curious about how that tracks vs actual victims found in Central Park during those same years.