
The election of 2012 saw an important shift in the way politics is conducted and in the way it is covered by the media. Whether we’re looking at President Obama’s team of number-crunchers or the rise of Nate Silver’s 538 Blog, politics is more quantitative than ever. For the most serious political thinkers, polls and numbers are one of the the most important tools of political analysis. But, this is Overthinking It, so we have to ask: can we use these tools to look at fictional Presidents? How does our most famous pop-culture Commander in Chief stack up against real-life Presidents?

For 7 years beginning in1999, “The West Wing” was the most prominent pop-culture portrayal of Presidential power and of politics. For fans of the show, President Bartlet was the kind of President we could only dream of having. The show was on for more than 100 episodes, and like any real-life POTUS, he guarded his approval rating jealously. With that much data out there, I set out to chart President Bartlet’s approval rating over this first term, and compare it to the modern era of U.S. Presidents.
Methodology
Before I dive in, I’d like to discuss how I arrived at the data. First of all, I focused only on Bartlet’s first term in office, taking it through the half-way point of Season 4. Seasons 5-7 just didn’t have enough data to make much headway – mentions of approval rating disappeared almost entirely. I also made one major assumption: that any event significant enough to move the needle more than a few points would have been portrayed in an episode – it’s unlikely that we fought a major war or the administration suffered a major scandal that happened entirely off-screen.
I’ve got a more detailed description of my methodology below, but if you want to skip right to the graph, the basic process was:
- Find all explicit mentions of approval rating in the transcripts
- Make a subjective judgment for each episode whether the approval rating was like to go up or down following the events of the episode
- Interpolate between that data
- Add some noise to make it look more realistic
If you want to know more, read on, otherwise you can skip to “Analysis” below.
I used the “West Wing Transcripts” website and scoured them for any mention of “Approval”, “Points”, “Percent”, etc. I am fairly certain that I got all explicit mentions of where the approval rating was, but it’s possible that it was discussed colloquially in a way that did not come up in my search – if you find one, please let me know in the comments. All told, I found 13 explicit mentions of the President’s approval rating, spread out over his first four years (there is also a flashback to the first few weeks in office that provided two data point.)
After finding all of those mentions I matched the episodes up with a timeline of the administration. The series creators have said that there intention was not to peg the Bartlet administration to any specific year, but that ship sailed when Sam Seaborne talks about using a particular room for the “Millennial Celebration.” I assumed that the years of the show matched up with the years of the Presidency, and I relied extensively on the work already done at the “Unofficial Continuity Guide.” Some episodes have very specific events that date them (Holidays, the Inauguration, etc.), and those served as anchors for the rest of the timeline. For episodes without those markers, I assumed that the air-date was the same as the “In-universe” dates, excepting times where this would have been inconsistent with one of the in-universe cues.
There is one big inconsistency that I ultimately had to make a subjective choice on – the Season One Finale (“What Kind of Day Has it Been”) aired in May and appears to have occurred around that time because it comes just one week after a string of spring episodes (starting with “Let Bartlet be Bartlet.”) In the Season Two Premiere (“Midterms”), however, it’s stated that the assassination occurred 14 weeks before Election day, placing the shooting in August. In the end, I just had to pick one and put it at May – we’re told that his approval rating goes up to 81 after the shooting, and he’s clearly come back down when the Midterms come around. It makes more sense that he would fall that much in six months as opposed to just three.
After making that timeline, I placed the explicit mentions of the approval rating next to the appropriate episode. From there, I looked at the remaining episodes and made a subjective judgment, based on the events of the episode and scored it as either “UP”, “DOWN” or “EVEN.” I used the explicit mentions as benchmarks and went from there. Those are the points marked in orange on the graph as “Episodes” – based on data from the episodes themselves.
The remaining data is just interpolation of the episode data with some random noise introduced to give the graph a more natural look. Again, I assumed that major events are captured in the actual episodes, so the interpolated data shouldn’t be a substantial departure from what we would expect.
Analysis
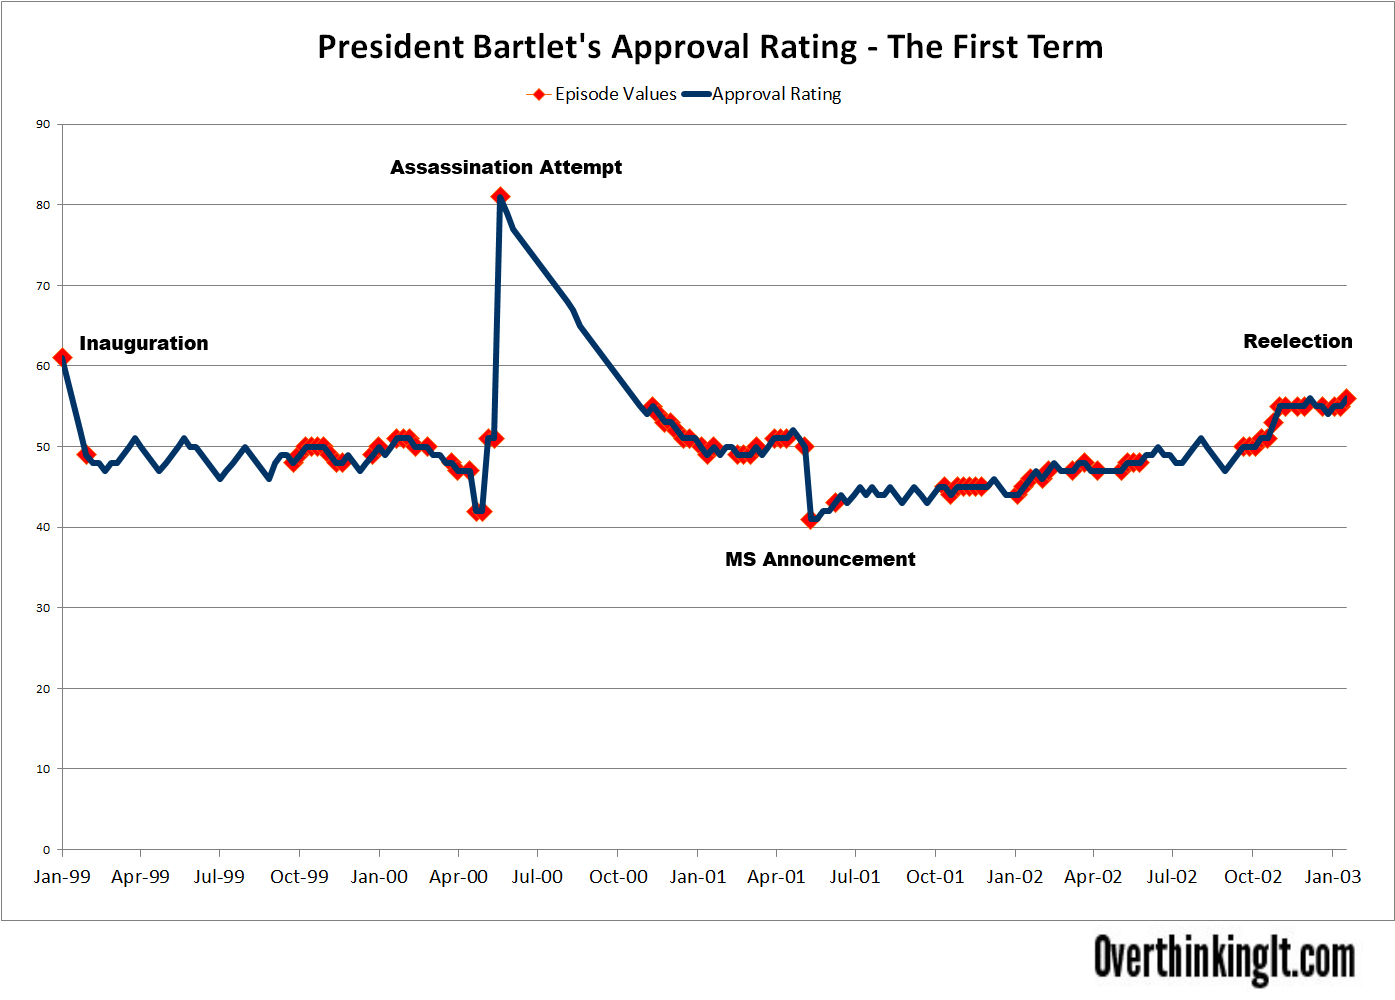
The fully interpolated data is in blue, with the data points based on actual episodes marked in red.
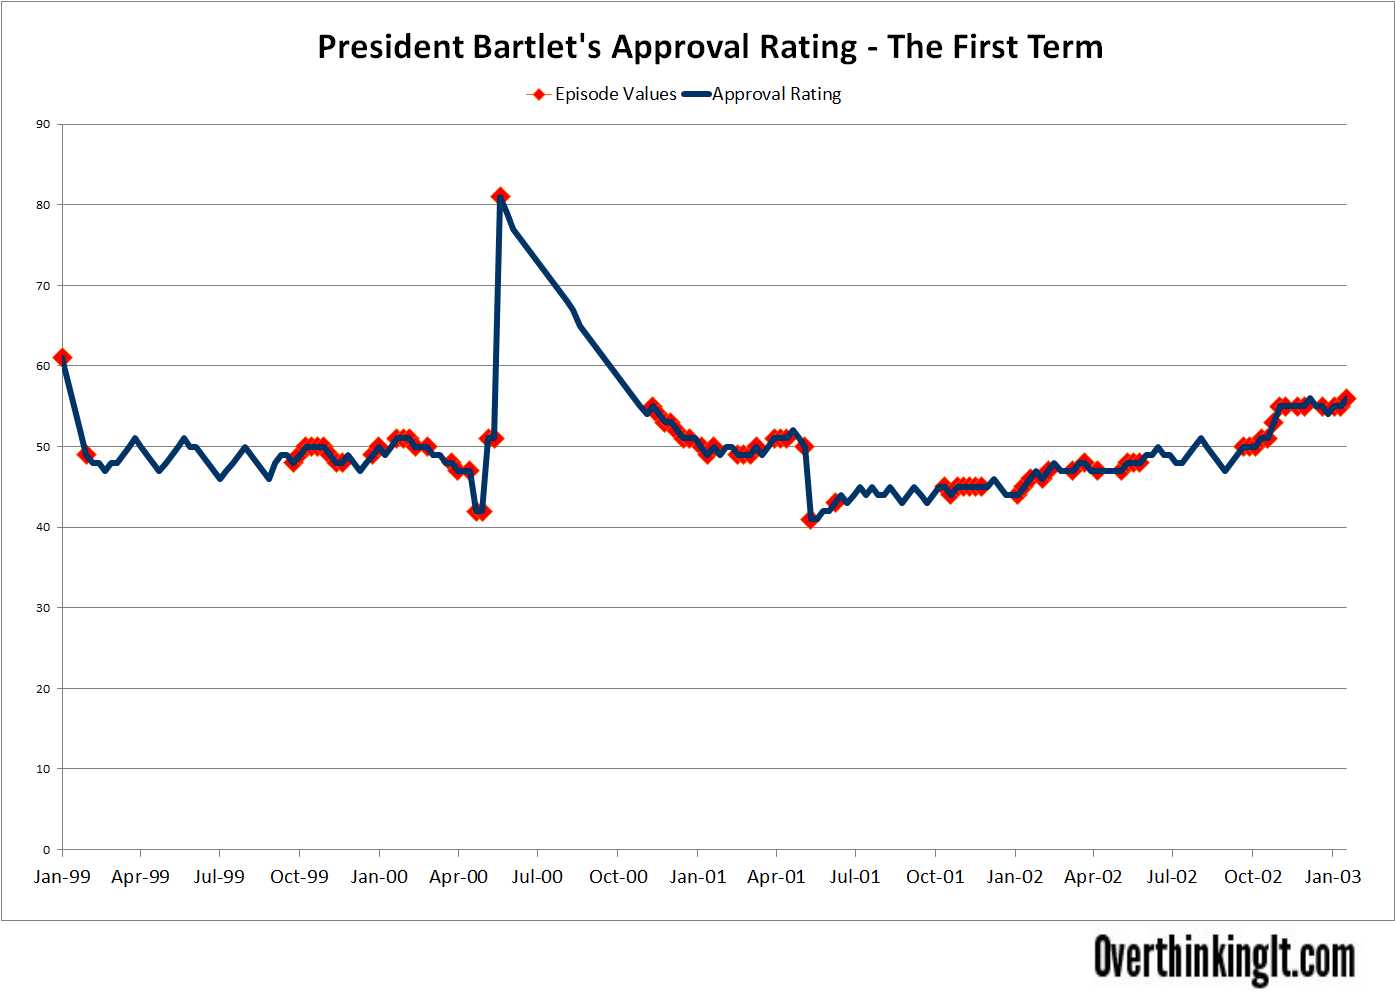
The graph is clearly dominated by three key events – the assassination attempt on the President (Season 1 Finale), the MS announcement (Season 2 Finale) and the campaign against Governor Ritchie (Season 4). Those events are reflected below:
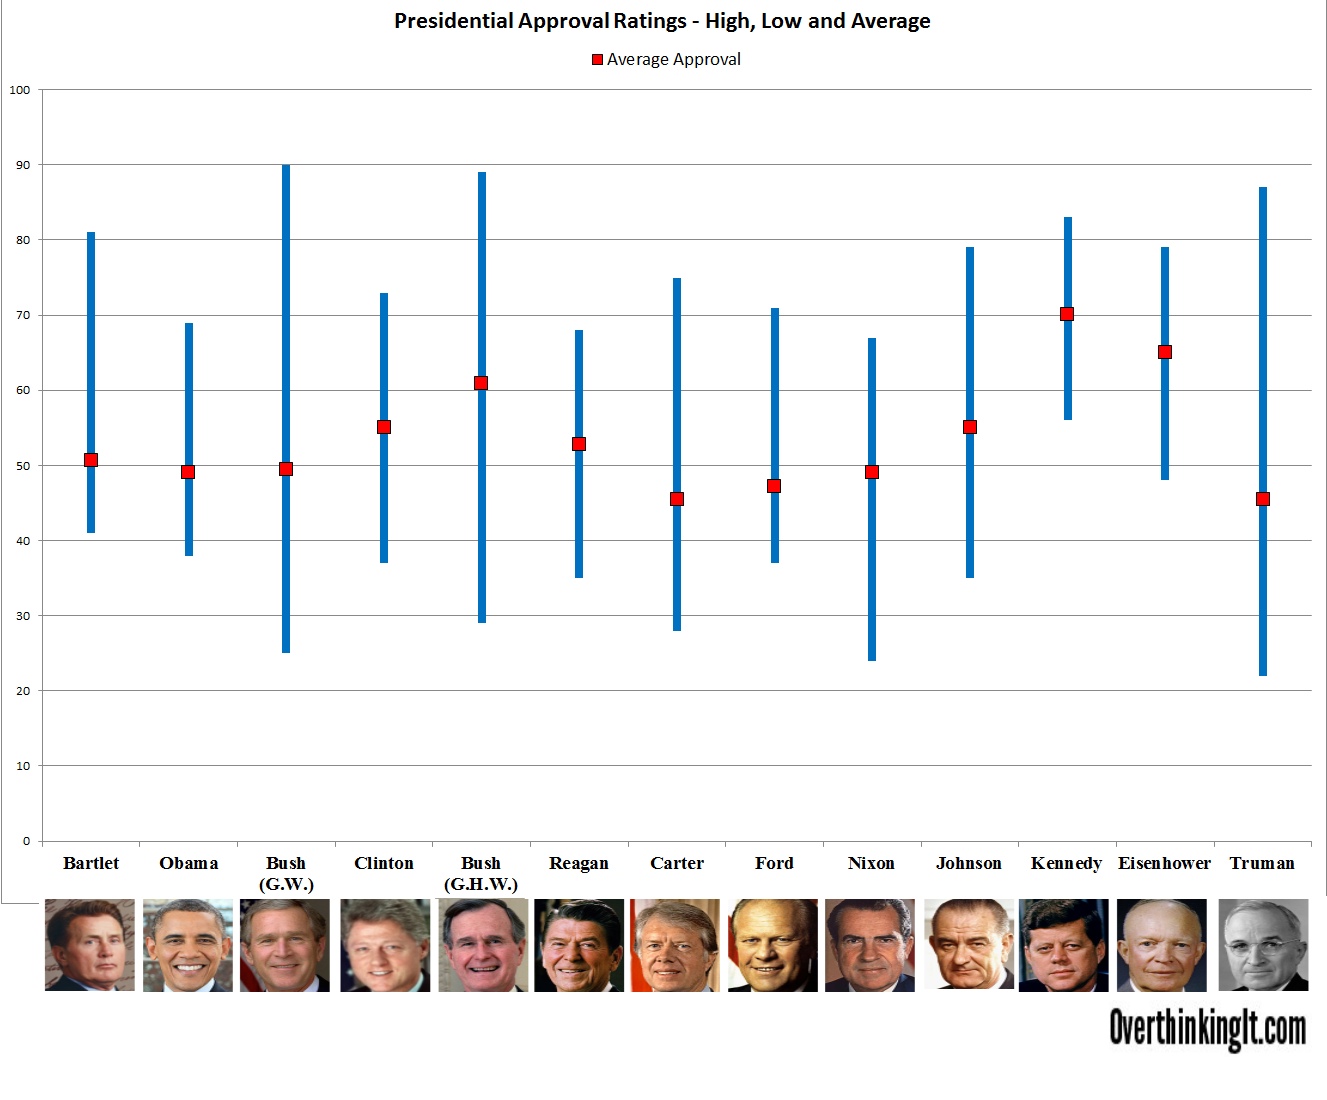
Of course, the graph can’t be looked at in isolation. Next I wanted to compare it to data from real life Presidents. The excel sheet has more specific data from all Presidents dating back to Reagan, and Wikipedia has graphs for all President dating back to FDR. Most importantly, Gallup has data that summarizes the data for Presidents since Truman. What I wanted to look at is how Bartlet compares to other Presidents along a few different statistics. The data is summarized in this chart. The blue lines represent the high/low of that President’s approval rating, the red boxes represent their average approval rating across their entire term.
Check the next page for some analysis…..
Given how early in Reagan’s term his assassination attempt took place and how high his ratings were when it happened make is a particularly good test case to gauge how big a bump should be expected for an assassination attempt. There is an upper limit to how high approval ratings can go and Reagan was already pretty close to there during his first few months in office. Thus, I don’t think the huge bump Bartlet received to be that unreasonable given how low they were when it happened.
Actually, the 3 month drop is consistent with ideology in the US. Once the media-storm dies down and sympathy fades, (which happens very quickly in the US) the “14 weeks” path makes a lot more sense.
I believe CJ warned that number was false and would “Drop Quickly”, too.
It’s weird that he doesn’t take a major hit for his MS cover-up. Imagine if Bush 43 or Obama had a health scandal of that magnitude. The press on the opposite side of the political spectrum would eat them alive! But there’s probably two reasons for that, I figure.
First, IMO, it’s because Sorkin meant the MS thing to be a wholly defensible version of the various Clinton scandals that plagued the Presidency in the 90s, as various characters reference FDR’s own secret medical problem, implicitly giving Bartlet cover. His poll numbers don’t fall so much because it’s not meant to be an immoral scandal.
Second, it’s because Bartlet’s *first term is very much a meditation on the politics and political culture of the 1980s and 1990s, and don’t reflect the relentless partisanship of the 2000s and 2010s. Which, to be fair, only really solidified in the fiery lead-up to the 2003 Iraq War, and the episode with Barlet’s reelection came a little before then. So his first term couldn’t meditate on what didn’t quite exist yet.
* His second term isn’t much different, I feel, and has no such excuse for its then-outdated sensibility. TWW is a great piece of dramatic fiction, but it never really adapted to the post-9/11 world very well. It always seemed to exist in a world where the American political culture never suffered the extreme polarization of the 2000s and 2010s… or, y’know, a major terrorist attack and two unpopular wars.
“has no such excuse for its then-outdated sensibility”
Well, it’s excuse is that it became a wish-fulfillment escapist fantasy for the kind of moderate-white-liberal types who by then had Clinton nostalgia.
Fair point. It was wrong of me to completely backhand escapism.
Exactly, JosephFM-this show was just a fantasy version of a Clinton Presidency without the “pesky” Fox News, Monica scandals, Whitewater and rape accusations, and with no terrorism threat!
Actually, this show was produced years before Hillary Clinton ever announced their candidacy for president, so there is no way that this was “a fantasy version of a Clinton presidency,” unless Aaron Sorkin was able to see the future. The last episode of the west wing ran in september of 2005, and Hillary Clinton ran for president the first time in the 2008 election, and then running again in the 2016 election, where she became the democratic nominee for president.
*slow clap*
It could be the difference between a personal scandal and a job performance perception. Clinton’s low comes early in his presidency; the scandal that plagued his second term didn’t affect his rating much. GW Bush’s approval is lowest at the end of his second term – he didn’t do anything wrong personally then. His rating seems to reflect how people thought the country was faring under his watch.
The “underthink” on this is that it really demonstrates that the writers had only a shaky grasp of the numbers on a historical scale, with the range in the series based more on their recent experience with Clinton and W than on realistic numbers.
If it helps I seem to recall a couple of approval ratings mentions in the later reasons. I’m pretty sure they reference Bartlet’s approval rating during his daughter’s kidnapping and the downturn it takes when the government gets shut
down. They also refer to it being in the 60s during the presidential campaign to elect his successor.