

“A wizard’s data is never accurate nor inaccurate. He graphs it precisely how he means to.”
[Update: I’ve uploaded the raw data to Google Docs for your number crunching pleasure.]
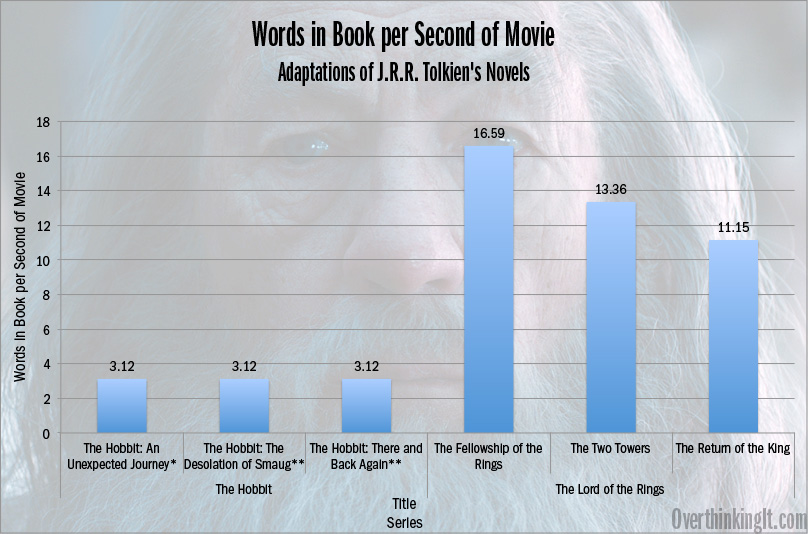
In last week’s article, I started with a simple question: how do book lengths, as measures by word count, compare to their adapted movie run times, as measured by seconds? I was mostly looking for a statistical basis to express my displeasure at The Hobbit: An Unexpected Journey (and by extension, parts 2 and 3 of this unnecessary trilogy), but I wound up comparing the density of the Hobbit movies, as measured in Words in Book per Second of Movie (WIBPSOM), to other prominent movie adaptations of books: The Lord of the Rings, The Hunger Games, and the Twilight franchises.
The findings were interesting in and of themselves (TL;DR: The Hobbit Books have way smaller WIBPSOM values than the other franchises), but they begged for a larger scale analysis, both in size of dataset and scope of inquiry. To address the size of the dataset, I found all of the (English language) entries on this list of best-selling books that have theatrically-released, non-silent movie adaptations. After including multiple movie adaptations of the same movie and excluding movies where I couldn’t find any data on book length as measured by word count, I came up with a dataset of 59 movie adaptations of best selling books.
As for scope of inquiry, well, let’s get down to brass tacks: is there any relationship between the density of a book’s movie adaptation, as measured by WIBPSOM, and the quality of the movie, as measured by its IMDB rating?
In a word, the answer to this intriguing question is an emphatic “no.”
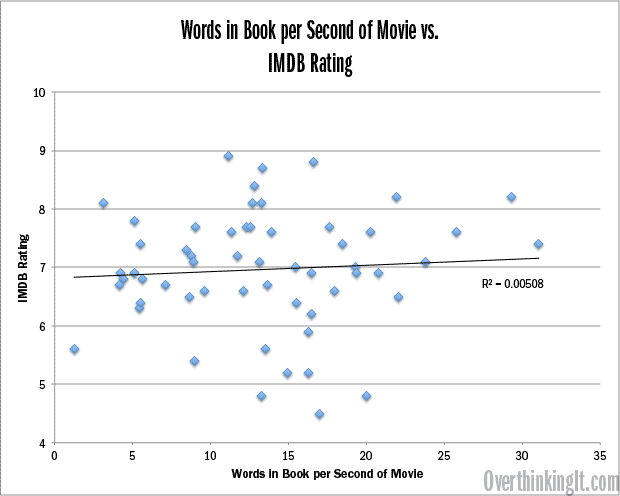
Click for larger version
Don’t let the slightly inclined trend line fool you into thinking there’s any there there: the positive correlation is weak to the point of being utterly nonexistent. Let me repeat: there is no statistical correlation, much less a suggestion of causation, between the density of a book’s movie adaptation as measured by WIBPSOM and its quality as measured by IMDB ratings. None whatsoever.
But did any of you seriously expect there to be? I hope not. I acknowledged over and over again that this sort of analysis is highly reductive by its nature and absolutely does not take into account the different ways books convey plot or the different ways movies add to, subtract from, and otherwise distort those stories, to say nothing at all about how they go about adapting those stories to the visual medium. That being said, I felt like we had to run these numbers and put this question to rest. So you’re welcome, Internet.
Now that we’ve put that question aside, let’s press on with less crucial, but still interesting avenues of inquiry. Another idea that I surfaced in Part 1 was that studios are splitting single novels into multiple books as cynical cash grabs, The Hobbit being just the most egregious example of this practice. The last installment of the Twilight, Harry Potter, and Hunger Games franchises have been or will be split into two parts, which led me to ask: is this a recent trend, a symptom of Hollywood’s increasing greed and laziness?
The answer is “no, probably not.”
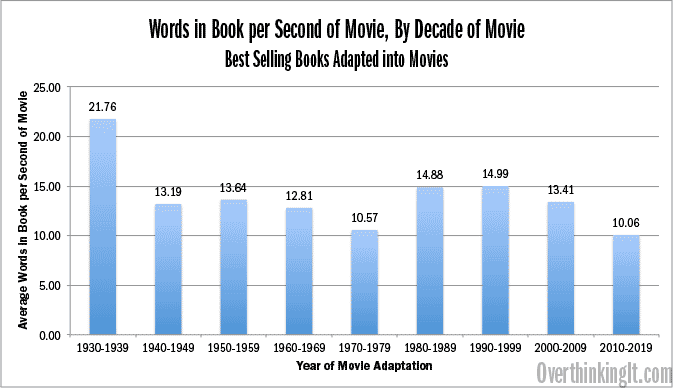
Click for larger version
Sure, there seems to be a slight downward trend starting from 1980 through the current decade, but remember that the current decade isn’t complete yet and has years of movie adaptations left to counteract the Hobbit-induced low WIBPSOM. In other words, if you’re looking for metrics that point to increasing Hollywood greed and laziness, you’re better off looking elsewhere.
The last idea from Part 1 that warranted further analysis from an expanded dataset was that there might be an “sweet spot” WIBPSOM value that moviemakers should shoot for when adapting movies from books. If “sweet spot” implies a level that leads to quality, then as we demonstrated with the first graph, such a thing does not exist. But if we think of the “sweet spot” as a value that’s typical across the large range of book-to-movie adaptations, then sure, we can use the data to see if such a thing exists.
And hey, it seems like we have something here!
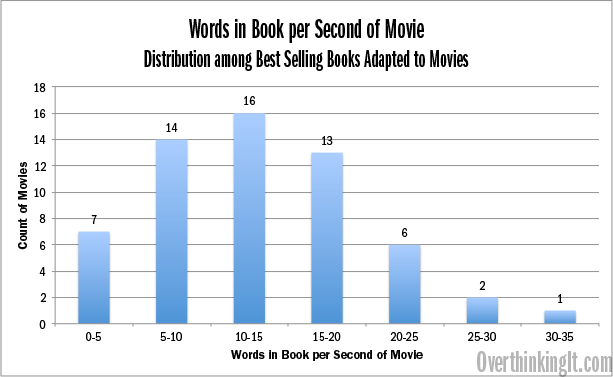
Click for larger image
Among the 59 movies in my dataset, it’s most common for adaptations to fall in the 10-15 WIBPSOM range. Titles ranging from To Kill a Mockingbird to both parts of Twilight: Breaking Dawn land here.
Now, does this mean that a filmmaker should aim for the 10-15 WIBPSOM range? Absolutely not, for all the reasons I’ve described above. Nevertheless, it’s interesting to see how this distribution naturally shakes out into a tidy bell curve centered around 10-15 WIBPSOM. And in case you’re wondering, the sole occupant of the 30-35 band is Harry Potter and the Order of the Phoenix: 257,154 words, 138 minutes, and a 31.06 WIBPSOM.
So what, then, are we to make of these findings (and non-findings)? Not a whole lot, I’ll readily admit. I’m glad that I’ve sparked a lot of conversation about this topic, and that we’re able to invoke some data in the conversation, but in some ways I’m equally glad that I’ve been able to use that same data to show the limitations of their usefulness when it comes to describing something so subjective as plot content in a novel or movie. At the end of the day, after we’re done accusing movie studios of making cynical cash grabs, and after we’re done accusing me of making reductive data models (guilty as charged), we still have the utterly unpredictable and unquantifiable art of storytelling.

418,053 words, 238 minutes, 29.27 words in book per second of movie. As God as my witness, I’ll never go without data again.