

The election of 2012 saw an important shift in the way politics is conducted and in the way it is covered by the media. Whether we’re looking at President Obama’s team of number-crunchers or the rise of Nate Silver’s 538 Blog, politics is more quantitative than ever. For the most serious political thinkers, polls and numbers are one of the the most important tools of political analysis. But, this is Overthinking It, so we have to ask: can we use these tools to look at fictional Presidents? How does our most famous pop-culture Commander in Chief stack up against real-life Presidents?


For 7 years beginning in1999, “The West Wing” was the most prominent pop-culture portrayal of Presidential power and of politics. For fans of the show, President Bartlet was the kind of President we could only dream of having. The show was on for more than 100 episodes, and like any real-life POTUS, he guarded his approval rating jealously. With that much data out there, I set out to chart President Bartlet’s approval rating over this first term, and compare it to the modern era of U.S. Presidents.

Methodology
Before I dive in, I’d like to discuss how I arrived at the data. First of all, I focused only on Bartlet’s first term in office, taking it through the half-way point of Season 4. Seasons 5-7 just didn’t have enough data to make much headway – mentions of approval rating disappeared almost entirely. I also made one major assumption: that any event significant enough to move the needle more than a few points would have been portrayed in an episode – it’s unlikely that we fought a major war or the administration suffered a major scandal that happened entirely off-screen.
I’ve got a more detailed description of my methodology below, but if you want to skip right to the graph, the basic process was:
- Find all explicit mentions of approval rating in the transcripts
- Make a subjective judgment for each episode whether the approval rating was like to go up or down following the events of the episode
- Interpolate between that data
- Add some noise to make it look more realistic
If you want to know more, read on, otherwise you can skip to “Analysis” below.
I used the “West Wing Transcripts” website and scoured them for any mention of “Approval”, “Points”, “Percent”, etc. I am fairly certain that I got all explicit mentions of where the approval rating was, but it’s possible that it was discussed colloquially in a way that did not come up in my search – if you find one, please let me know in the comments. All told, I found 13 explicit mentions of the President’s approval rating, spread out over his first four years (there is also a flashback to the first few weeks in office that provided two data point.)
After finding all of those mentions I matched the episodes up with a timeline of the administration. The series creators have said that there intention was not to peg the Bartlet administration to any specific year, but that ship sailed when Sam Seaborne talks about using a particular room for the “Millennial Celebration.” I assumed that the years of the show matched up with the years of the Presidency, and I relied extensively on the work already done at the “Unofficial Continuity Guide.” Some episodes have very specific events that date them (Holidays, the Inauguration, etc.), and those served as anchors for the rest of the timeline. For episodes without those markers, I assumed that the air-date was the same as the “In-universe” dates, excepting times where this would have been inconsistent with one of the in-universe cues.
There is one big inconsistency that I ultimately had to make a subjective choice on – the Season One Finale (“What Kind of Day Has it Been”) aired in May and appears to have occurred around that time because it comes just one week after a string of spring episodes (starting with “Let Bartlet be Bartlet.”) In the Season Two Premiere (“Midterms”), however, it’s stated that the assassination occurred 14 weeks before Election day, placing the shooting in August. In the end, I just had to pick one and put it at May – we’re told that his approval rating goes up to 81 after the shooting, and he’s clearly come back down when the Midterms come around. It makes more sense that he would fall that much in six months as opposed to just three.
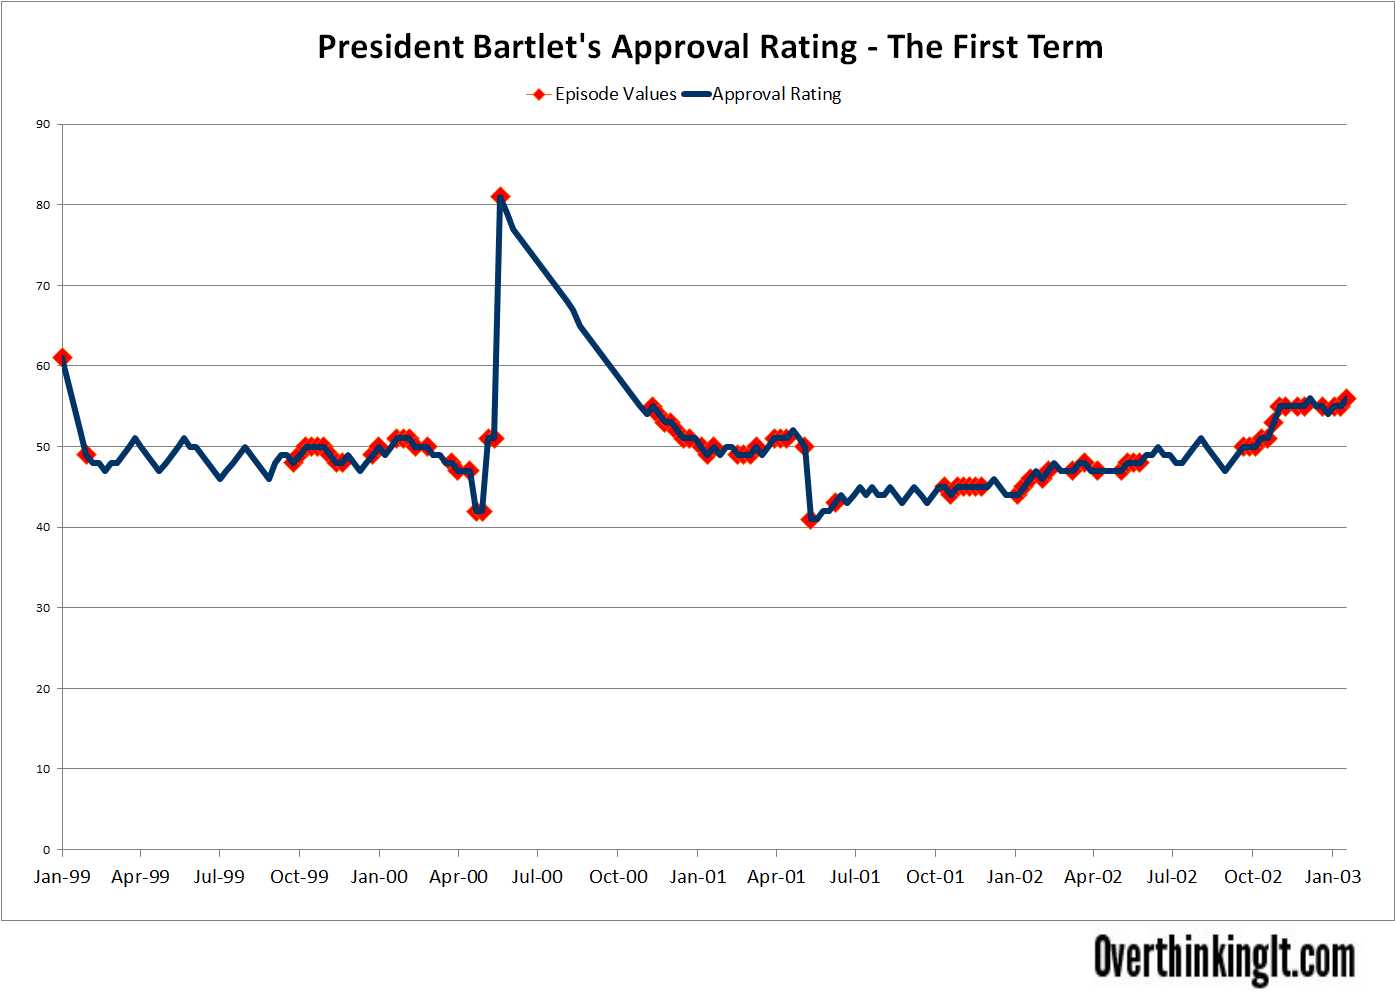
After making that timeline, I placed the explicit mentions of the approval rating next to the appropriate episode. From there, I looked at the remaining episodes and made a subjective judgment, based on the events of the episode and scored it as either “UP”, “DOWN” or “EVEN.” I used the explicit mentions as benchmarks and went from there. Those are the points marked in orange on the graph as “Episodes” – based on data from the episodes themselves.
The remaining data is just interpolation of the episode data with some random noise introduced to give the graph a more natural look. Again, I assumed that major events are captured in the actual episodes, so the interpolated data shouldn’t be a substantial departure from what we would expect.
Analysis
The fully interpolated data is in blue, with the data points based on actual episodes marked in red.
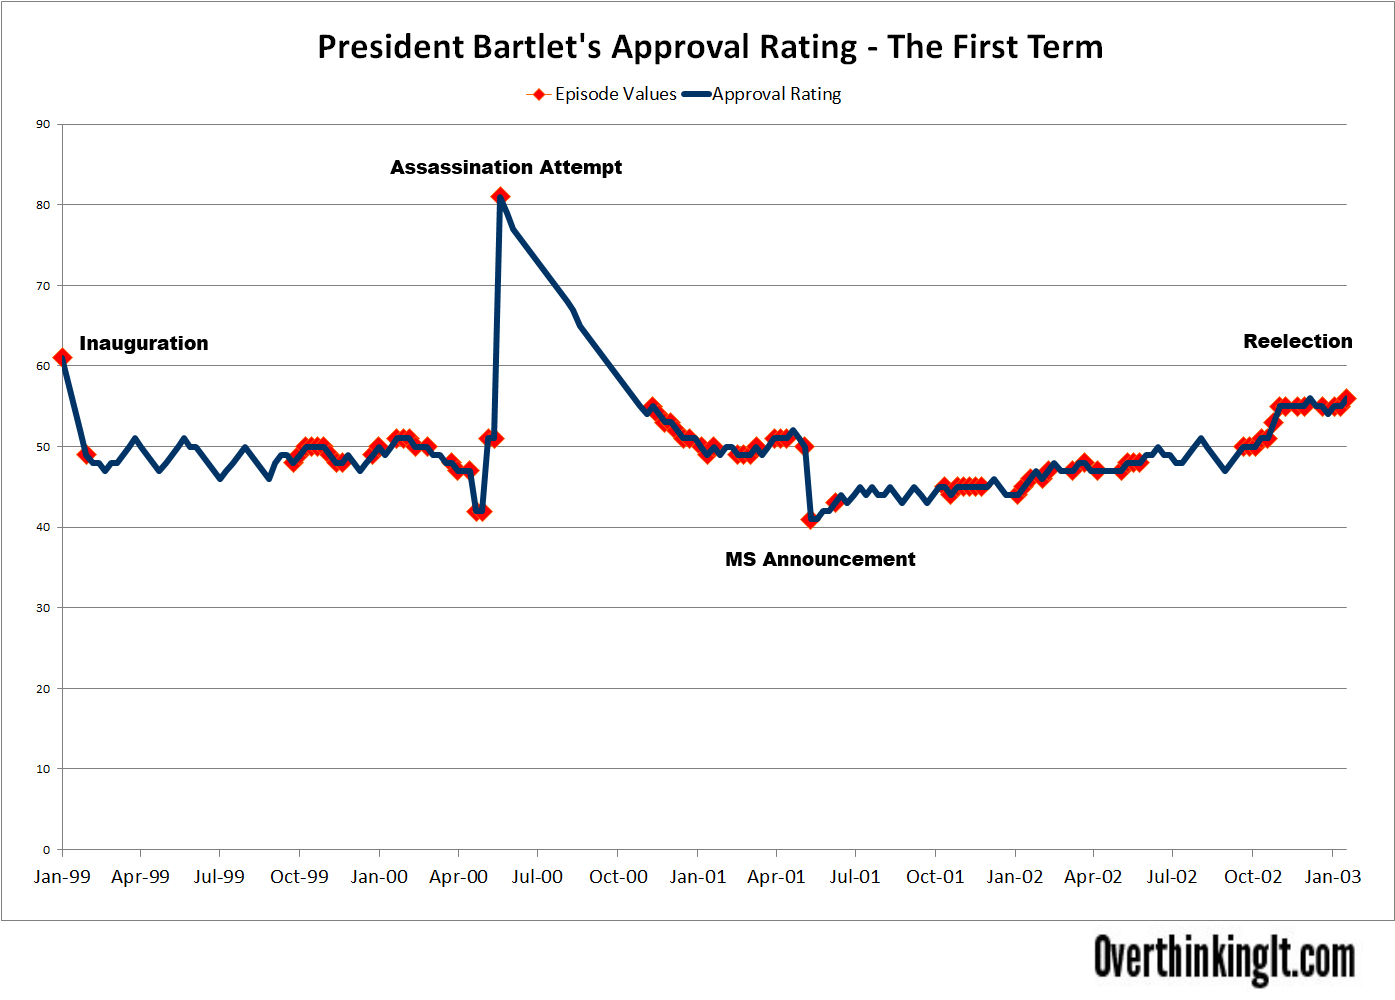
The graph is clearly dominated by three key events – the assassination attempt on the President (Season 1 Finale), the MS announcement (Season 2 Finale) and the campaign against Governor Ritchie (Season 4). Those events are reflected below:
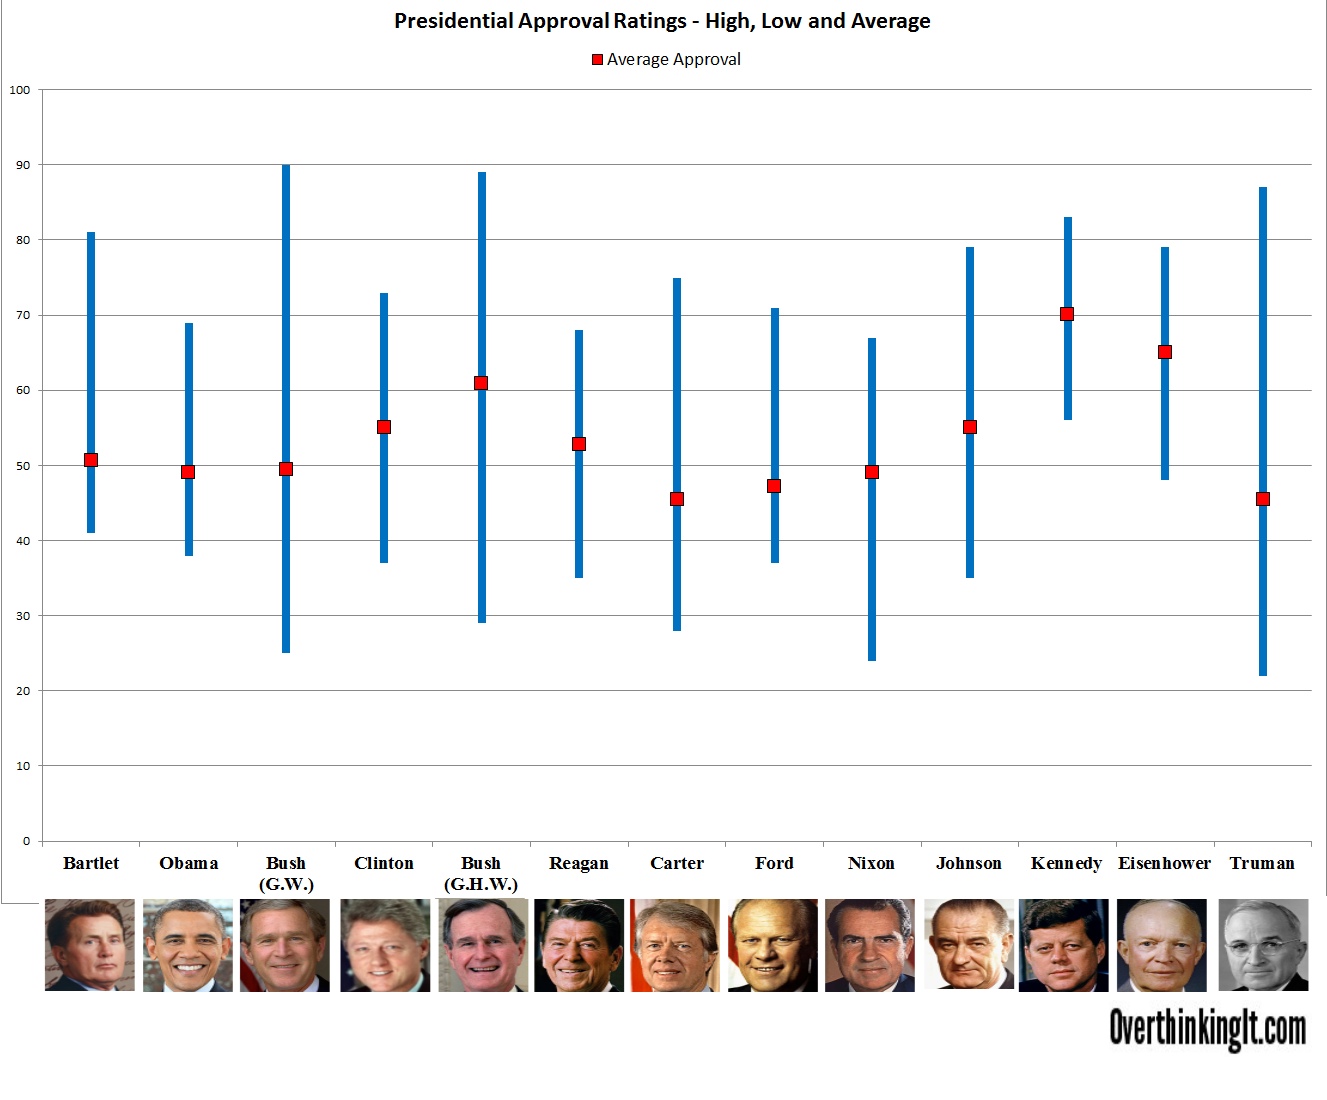
Of course, the graph can’t be looked at in isolation. Next I wanted to compare it to data from real life Presidents. The excel sheet has more specific data from all Presidents dating back to Reagan, and Wikipedia has graphs for all President dating back to FDR. Most importantly, Gallup has data that summarizes the data for Presidents since Truman. What I wanted to look at is how Bartlet compares to other Presidents along a few different statistics. The data is summarized in this chart. The blue lines represent the high/low of that President’s approval rating, the red boxes represent their average approval rating across their entire term.
Check the next page for some analysis…..
First, let’s look at the average of the data. President Bartlet is portrayed as a relatively popular President. I expected this to mean that his average approval rating would be relatively high compared to past Presidents. Instead, his rank is right in the middle – out of the last 13 Presidents, Bartlet ranks 7th in overall average approval:
|
Average |
|
Next, I looked at “Highest Approval Rating” and “Lowest Approval Rating.” I expected that President Bartlet would have greater extremes than real Presidents. After all, “The West Wing” is a fictionalized drama, and you can’t have drama without, well, drama.
| Highest Approval Rating Reached: | Lowest Approval Rating Reached: |
|
|
His high (81) is pretty high, second only to both of the Bush Presidents in the last few decades. It’s a little questionable whether or not the assassination attempt would really have resulted in a spike that large. The plot line is likely modeled after the attempt on Reagan’s life in 1981 – which only resulted in a modest bump (6 or 7 points), not the 30 point bump that Bartlet received. Of course, there’s one key difference – the motivation for the Reagan shooting was a lone crazy person, so would be less likely to resonate with the general population. The Bartlet shooting, on the other hand, had a clear political and racial motivation – when it comes to Bartlet v. the KKK, people might feel much more inclined to change their opinion.
Bartlet’s low, on the other hand, is relatively high – his lowest approval rating was only 41, higher than all except for Eisenhower and Kennedy, both exceedingly popular Presidents. From this data, it strikes me that the show is overly optimistic about Bartlet’s recovery after a major personal scandal like the MS announcement. The Season 2 Premiere “Manchester” states that his approval dropped down to 41, and it’s stated that it went up slowly from there in “Manchester (Part 2).”
Looking at other recent Presidents, I find it hard to believe that a major scandal like that would only bring the approval down to 41 – Presidents Obama, Clinton and G.W. Bush have all dipped below that number at one point or another, and despite Bartlet’s overall popularity, there’s no reason to believe this scandal would not have affected him worse than portrayed.
One last thing I wanted to focus on was the relative “Controversy” of different Presidents – what’s the difference between the “Highest” and “Lowest.”
| Controversy |
|
Perhaps unsurprisingly, G.W. Bush is the most controversial President of the last few decades – his high immediately after the September 11th attack is the highest approval of any President on the list. His lowest, towards the end of his time in office, is also one of the lowest total approval ratings.
Bartlet, on the other hand, is a middle-of-the-road President from the standpoint of controversy – his upper/lower spread of 40 is right in the middle. This is somewhat surprising given the somewhat crazy things that happened during the Bartlet first term, one would expect that his highs and lows would put him in the more extreme category.
So what does all this say about The West Wing? My expectation going into this was that a fictional President like Bartlet would be more “dramatic” than the real thing. In reality, his numbers were relatively staid and moderate. The truth, it turns out, is more dramatic than drama. That said, there’s a lot of data out there to look at, so please sound off in the comments.