

At Overthinking It, Law & Order is analyzed by two separate yet equally important groups: the people who watch the show and send in the data, and the people who build the spreadsheets. These are their findings…


Last May, I mourned the end of L&O by announcing a crowdsourced effort to catalog the outcome of all 456 episodes. At first, the responses poured in, as bountiful as Lenny’s wisecracks. After a month of so, everyone trailed off… except for a reader named Josh Kyu Saiewitz, who decided that this was the perfect opportunity to watch every Law & Order episode, in order. (If you think that’s impressive, you should check out Josh’s blog, where he’s attempting to consume every comic, TV show, movie, and video game featuring Batman, all in chronological order. He’s up to 1941.)
Josh recently made it through the halfway mark of the series. I won’t say he’s a hero – because what’s a hero? – but this post would be impossible without his efforts.
So… are you ready to Excel?

“Implied Guilty” refers to any episode where we didn’t actually see the defendant get convicted or plea out, but the show leaves us with the strong feeling it’s going to happen. For instance, the defendant’s wife tearfully agrees to testify against him. “Guilty of lesser charge” is when the DA was going for Murder 1, but the jury only convicts of Man 2 and Tampering With Evidence.
If you watch the show, you won’t be surprised that “Plea bargain” is the most common outcome. What might surprise you is that in the real world, over 95% of felony convictions come from plea bargains. You could argue that this makes L&O unrealistic. But who says that Jack McCoy doesn’t settle 95% of his cases? The series is only a record of his most interesting cases, so naturally we get a lot of trials. I’m sure Sherlock Holmes had a lot of boring cases, but Watson didn’t bother writing about those.
Okay, now let’s break it down season by season. The years represent when each season started.
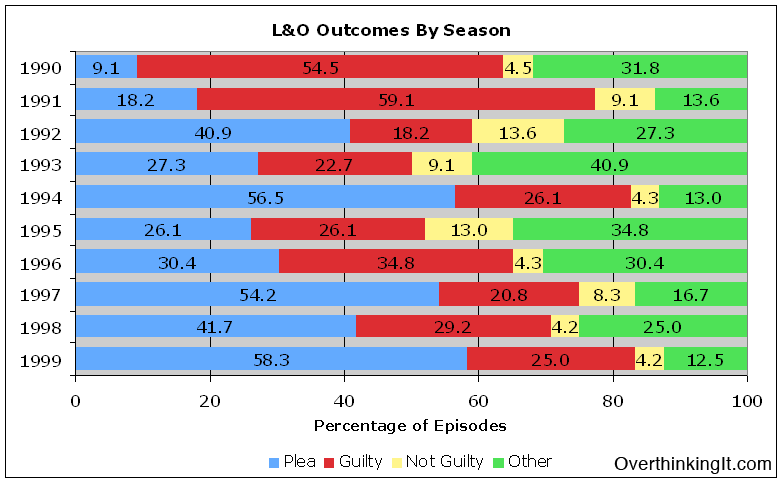
What’s immediately striking is how few plea bargains there were in the first season. All these cases not only went to trial, they went all the way to the verdict. This makes for good TV, but it makes the show less realistic. We never see Matlock negotiate a plea bargain, but nobody is mistaking Matlock for a realistic courtroom drama. On the other hand, we like to watch L&O and flatter ourselves that we understand a little bit of how the criminal justice system really works. In any case, by the show’s fourth season, over 40% of the episodes ended with a plea. That’s a fourfold increase.
Let’s kick it up a notch (bam). I combined the plea bargains and Guilty verdicts to calculate each season’s “Success Rate” — the percentage of episodes in which the DAs got their man. However, there are instances where I counted Guilty verdicts and pleas as failures (when the DA wanted a conviction for murder and had to settle for something less). Don’t worry: you can download my spreadsheet at the end of the post. Most of Josh’s notes are in there, so you can see why we decided the way we did.
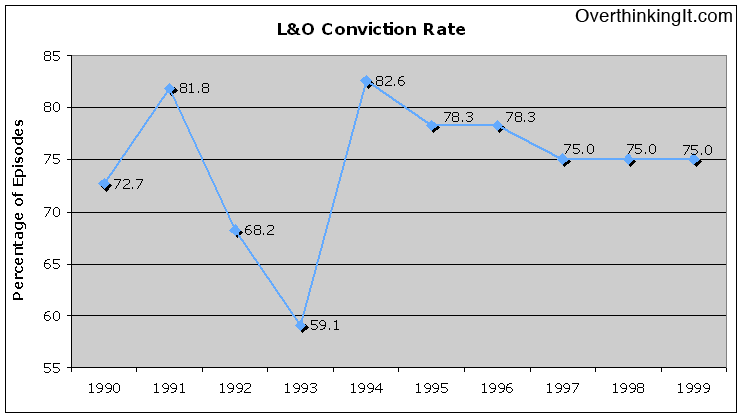
The success rate started high, went higher, and then plummeted to a bleak 59% in the 1993 season. That means in 2 out of every 5 episodes that year, the bad guy got away with it. That was followed by a dramatic reversal, as the series shot up to its highest conviction rate, before leveling off at a so-stable-I-almost-think-Dick-Wolf-planned-it 75%.
Okay, you say. Pretty chart. So what?
HERE’S what:
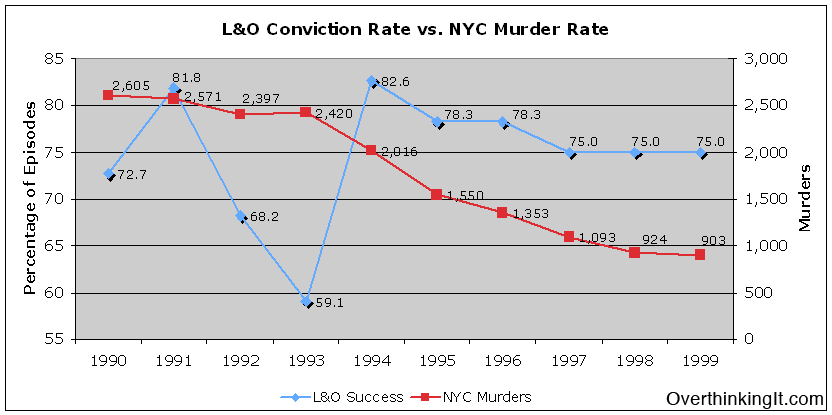
You see, 1990 was not only the first year of L&O, it was the high point for murders in New York City. There were more murders that year than at any point in the 1970s or 80s, and the body count stayed high throughout the early 90s. You see this reflected in the series. Sure, Law & Order started off with a lot of feel-good outcomes, because in 1990 a brand new show couldn’t afford to frustrate audiences. But the tone of the show quickly became one of helplessness and futility, to reflect how the people of New York were losing faith in actual law and order.
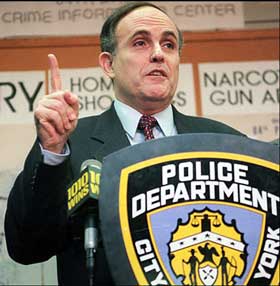
But in November 1993, at the same time the DAs of L&O were stumbling to a 59% success rate, Rudy Guiliani was elected Mayor. One of his big campaign issues had been, well, law and order, and tackling the crime rate was the centerpiece of his first year:
In his first term as mayor, Giuliani, in conjunction with New York City Police Department Commissioner Bill Bratton, adopted an aggressive enforcement-deterrent strategy based on James Q. Wilson’s “Broken Windows” approach. This involved crackdowns on relatively minor offenses such as graffiti, turnstile jumping, cannabis possession, and aggressive “squeegeemen”, on the theory that this would send a message that order would be maintained.

Take a look at 1994 on the chart above. The murder rate dropped by about 15%, and the L&O conviction rate shot up by more than 20%. There was a whole new feeling of optimism in the city and on the show (not to mention a young new DA by the name of Jack McCoy).
Actually, an 80% conviction rate is probably a little boring from a dramatic perspective, so it’s not surprising that the number goes down a little in subsequent seasons. Still, the real world murder rate continues to drop, and the L&O conviction rate stays high.
This all makes me very curious to follow the show out of the 90s, into the turbulent years after 2001. Does the conviction rate go down as people start to worry about the government’s ability to keep them safe? I’ll let you guys know as soon as I get all the data (no pressure, Josh). In the meantime, you’re welcome to use my spreadsheet for your own analysis, as long as you post your findings in the comment thread.
Ka-CHUNG.