Last year, I came up with a way of measuring how “episodic” a particular TV show is – the “Case of the Week Quotient.” In essence, the COTW Quotient measures how often a given episode of a show has a story arc that is entirely internal to the episode – a problem that is introduced at the beginning and resolved by the end of a given episode, and is largely unrelated to the overall arc of the season. As I wrote back then:
We can imagine putting shows on a spectrum of episodic-ness. At one extreme, you have shows like the original Law and Order, which went out of its way to obscure the lives of the detectives and lawyers that it portrayed….At the other end of the spectrum, there’s a show like Breaking Bad or Game of Thrones, where each episode is a just one link in a long chain of a single story arc….But in the middle, you have shows with elements of both.
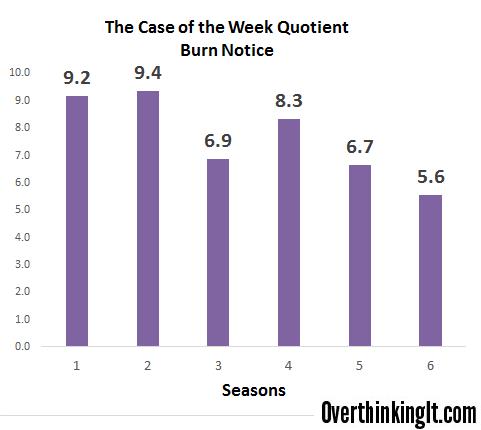
In addition to the big season- or series- long story arc, you have the “Case of the Week.” A show like Burn Notice is a good example. In general, each week we meet a new “client” with a problem that will be solved within the next 40 minutes or so, never to be seen or heard from again. But at the same time, we’ll also get a little piece of some bigger puzzle or mythology, inching our way towards the blow-out season finale.
Having identified a spectrum like this, I have to ask – can it be measured? Can we quantify the “Case of the Week”-ness of a season of television?
The method is relatively simple – count the number of episodes with a COTW, and divide by the total number of episodes. (Then multiply by 10 because my lizard brain likes numbers between 1 and 10 more than decimals.) With that out of the way, I’m going to look at a handful of shows using this metric, coding each episode of a show with either a “1” (if that episode has a COTW) or a “0” (if that episode is focused on the larger story arc or mythos).


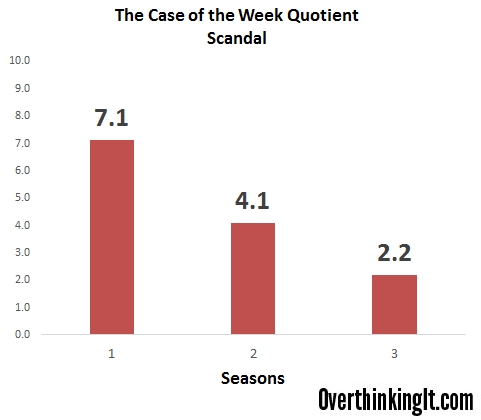
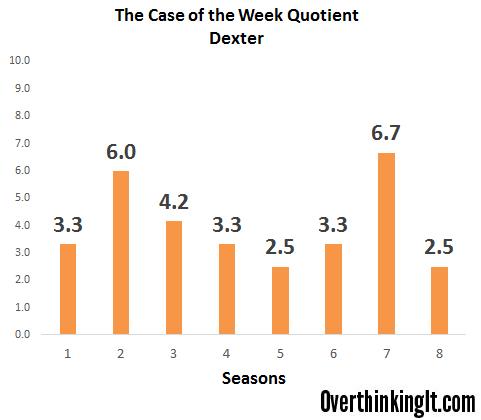
At the time, I measured three different shows: Scandal, Burn Notice, and Dexter. I came up with the following charts:
 And then I reached out to the fine folks out there in OTI-land for help – coding a series episode by episode is fairly time-consuming, and I wanted to cast a little bit wider net of shows to see what I could come up with. And boy did you come through in fine style! I received submissions from a number of different people, coding a diverse array of shows.
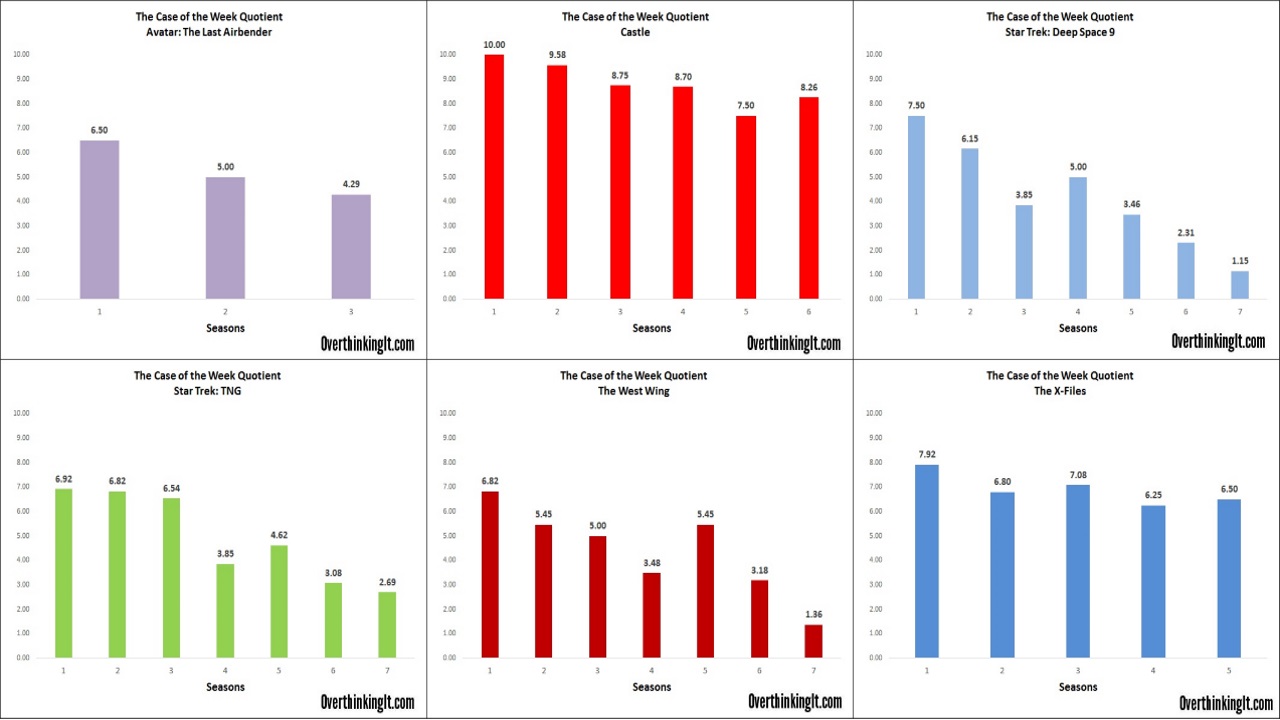
With that data in hand (and one show from me), I’ve got 7 new shows to add to my data set:
- Avatar: The Last Airbender, from Andrew Buonopane (@abgoobread)
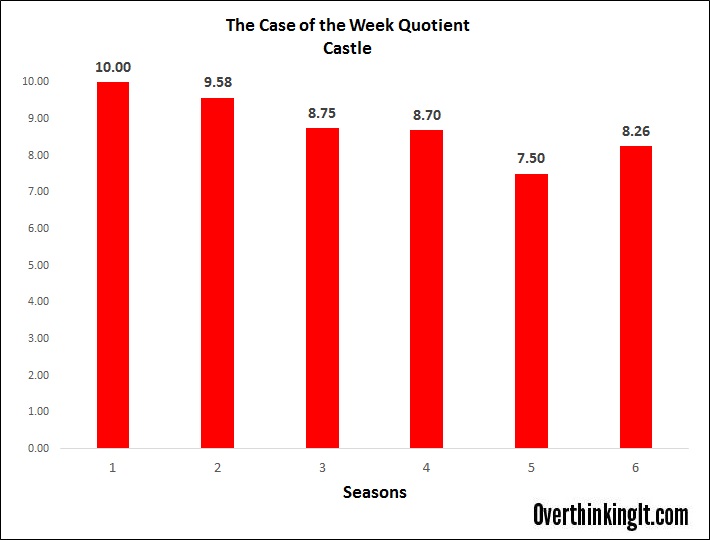
- Castle, from Amanda M
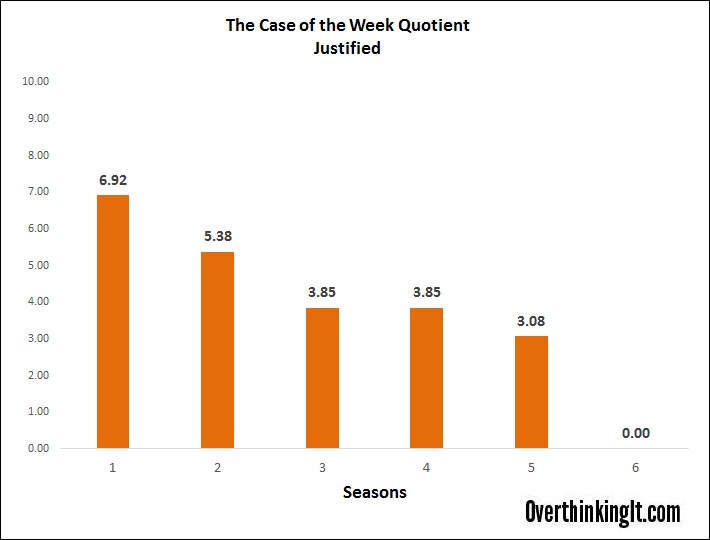
- Justified, from me
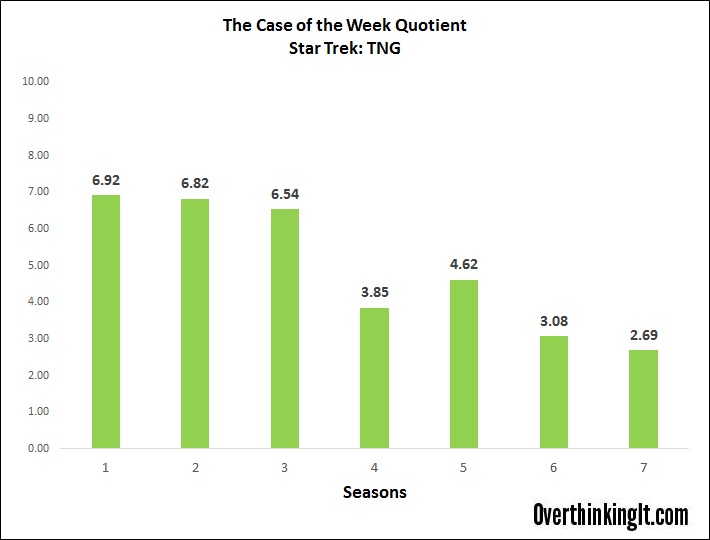
- Star Trek: The Next Generation, from N.G. Roberts
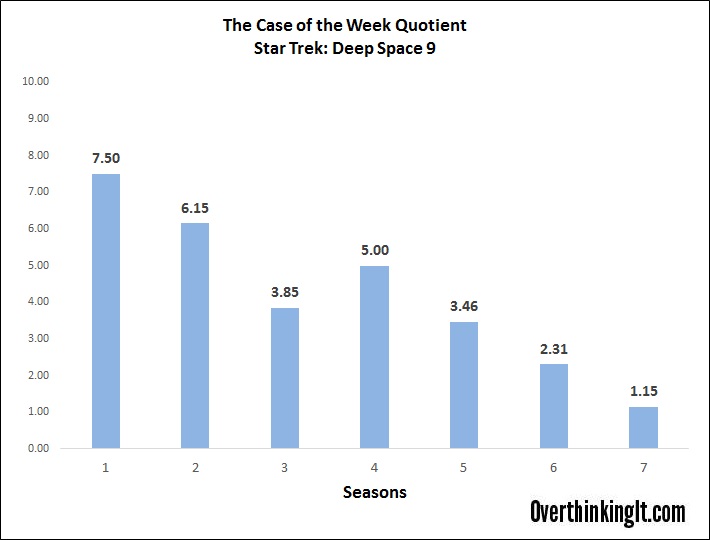
- Star Trek: Deep Space 9, from N.G. Roberts
- The West Wing, from N.G. Roberts
- The X-Files, from Logan Luce (http://faustandluce.tumblr.com/)
Here are the results (click to zoom):
![]()
The first time around, despite having only three datasets, I came up with a hypothesis:
There appears to be some sort of attractor, pulling shows away from the COTW and towards the mythology-centric story lines.
Now with 10 total shows, I can much more confidently claim that the COTW-quotient trends down over time. Taking all the shows above and averaging the seasons for which there is data together yields this:
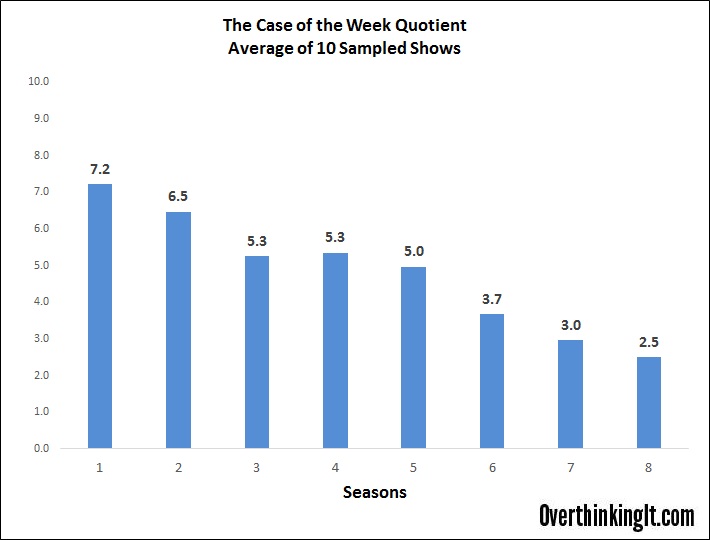
A strong downward trend. Of course, this data has some problems. Not all of the shows have 8 seasons worth of data – in fact, that 2.5 for the last season is just the 2.5 from the final season of “Dexter,” the only show in my sample to run for 8 seasons. Equally significantly, not all of the shows in the sample are starting from the same baseline – some shows never had a higher than 60-65% COTW quotient, while Castle started at 100% and never dipped below 75.
So what I need is some way to make the data more comparable. In that vein, I took each data set and reduced everything to a 1.0 scale – for each show, the season with the highest COTW quotient was set to 1.0, and then the rest of the seasons were measured as a fraction of that baseline (Note: In every case except Dexter, the first season had the highest COTWQ). Similarly, the number of seasons was changed to a 1.0 scale – so the first season of a show with 3 seasons has a value of .33, whereas the first season of a show with 4 seasons has a value of .25, etc. That yielded the following (admittedly confusing) chart:
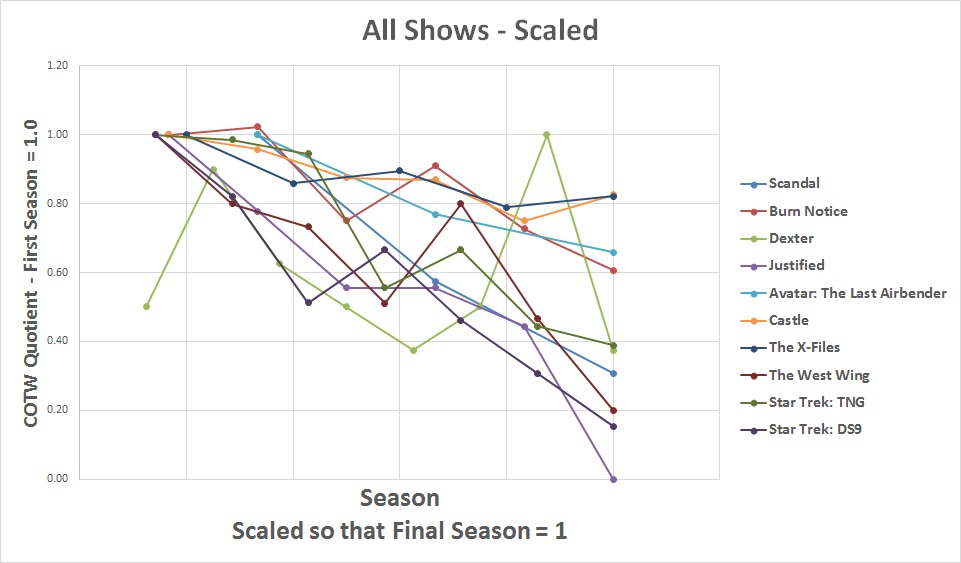
The downward trend is still there, but it’s much less obvious to follow. That said, placing everything on a scatter plot with a common scale allows at least a modicum of actual statistical analysis. Behold:
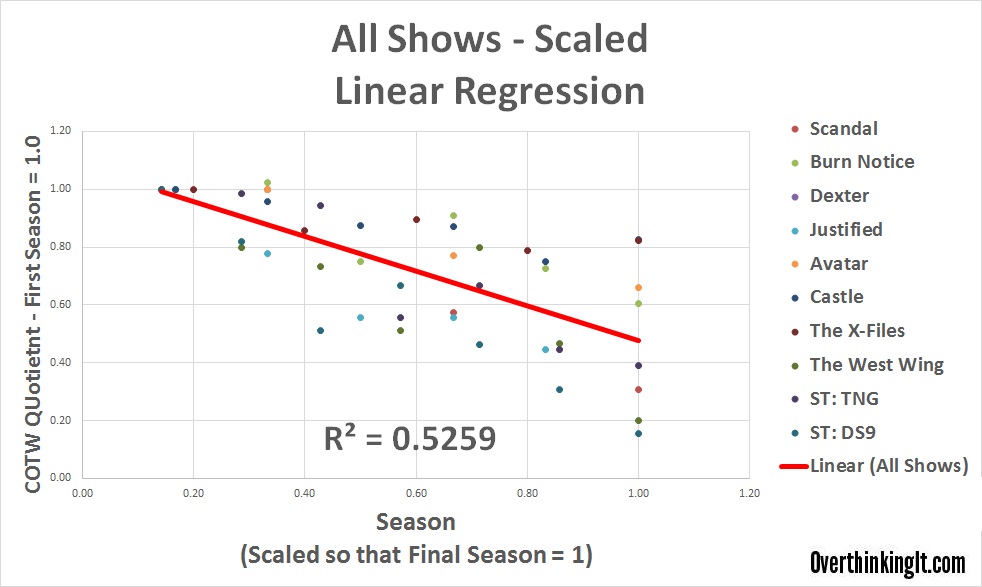
The trend is clearly down – with an R squared suggesting a modest, but not overpowering, correlation between the length of a series and increasing serialization.That in itself is a fairly interesting conclusion – I think I can quite confidently say that there is a strong attraction towards serialization and away from “Case of the Week.”
But a deeper look at some of the graphs suggests some more interesting behavior.
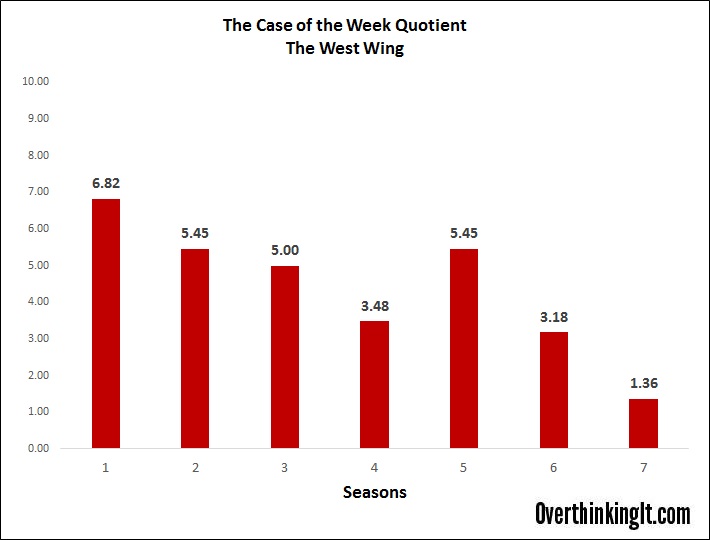
Take a look at the graph for The West Wing:
Over 7 seasons, the show demonstrates a clear downward trend – with an obvious “hump” right around Season 5. For anyone that followed The West Wing as it aired, there’s a fairly obvious explanation: series creator Aaron Sorkin left the show after Season 4, and Season 5 was the first season with a new set of head producers and writers.
Of course, that hump could have been a coincidence, so the observation put me on the hunt for other similar humps. Sure enough, I found them in both Star Trek: The Next Generation and Deep Space Nine.
In Season 5 for TNG and Season 4 in DS9, the inevitable trend towards serialization was halted temporarily. Looking into the history of those shows suggests a similar behind-the-scenes cause: for The Next Generation, Season 5 marked the death of Gene Rodenberry. For Deep Space 9, Season 4 marked the end of Next Generation and the importation of characters like Worf into the show.
This provides, I think, an interesting insight into the mind of a producer or writer forced to create a show week in and week out. In Season 1, the goal is just to get to Season 2; you’re still feeling out who the characters are and how they work with one another. That makes episodic storytelling ideal: neat plot lines with clearly defined beginning, middle and end.
But as the series goes on, two forces probably force creators away from the more episodic stories: first, we know the characters better, and are more interested in their back stories and long-term arcs. Second, the low-hanging fruit of episodic story telling is taken early, and so writers may find it easier to write to the mythology instead of coming up with a new bad guy to fight each week.
In the end, the COTW Quotient is at best an imperfect measure: I’m the first to admit that much of the episode-by-episode coding takes a lot of judgment calls and fine distinctions between what is and isn’t a “Case of the Week.” But the similar trends over time, and the correlations between things like the “hump” and shakeups in behind-the-scenes personnel makes me continue to believe that there’s something interesting here.
If you agree, I’d love to make a Part 3 – but that means more data! If there’s a show that you love, get out the episode guide, code the episodes, and send it in! You’ll be internet famous. This Excel sheet has all of my data, as well as a sheet marked “TEMPLATE” that you can use yourself. Your data should look something like this:
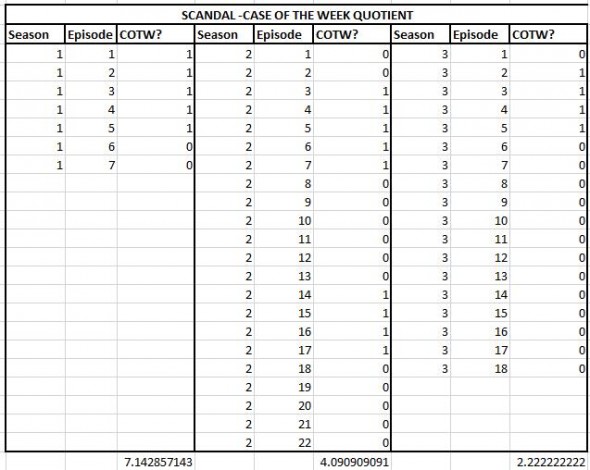
You can submit your data to [email protected].
you have ignored the elephant in the room…date of air. The primary difference in the episodic-ness may be the earlier a show ran, the more episodic the “mood” of the business was. Syndication meant that episodic shows were profitable, as they could be purchased and run by local stations in virtually any order, and keep in mind TNG was ENITRELY syndicated, never airing on any network.
Eeeeeee, I’m so glad to contribute! ;)
I think another thing that makes a difference is the nature of the show itself. The conceit of Castle is ‘detective show’, therefore obviously it would have a COTW. I would be curious to see how something like X-Files, CSI, Boston Legal, or Murder, She Wrote (literal Case of the Week shows) stack up vs. shows that are still episodic in nature, but with a broader theme from the outset, like Stargate SG-1 or Battlestar Galactica. (Or shows with 100% arc like Babylon 5 or BtVS, ha!)
I would be really curious to try and COTW something like Buffy, but there’s so many arcs within arcs that the dataset would be insane. There’s personal arcs (Oz’s werewolfiness got front & center a few times), and seasonal arcs (the Initiative), and overall show arcs (Willow getting more and more power-hungry from S2 on; don’t give me that last-minute crap about [magic = drugs], Marti, Willow’s been riding that particular snake for way too long), that I don’t think any one episode is arc-free. :P
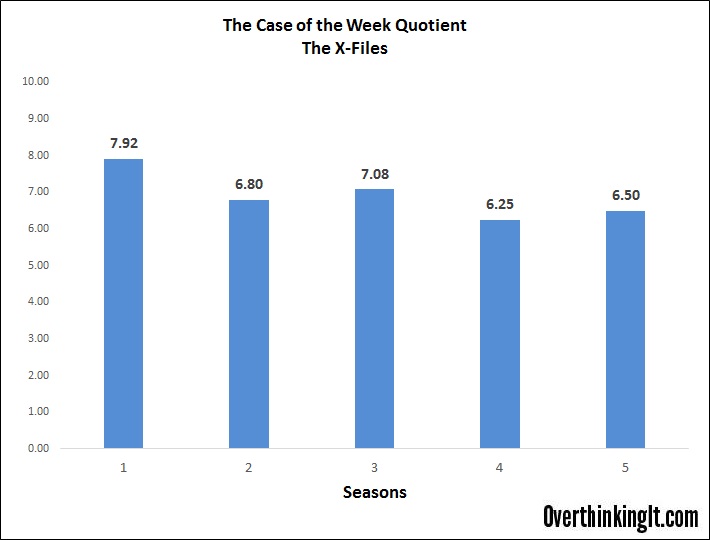
I strongly endorsed crunching the numbers on X-Files. The fans of that show started classifying episodes as “Mythological” or “Monster of the Week” from the very beginning.
Hannibal would be an interesting one to look at because the trend you describe gets telescoped. Season one is 70% COTW, season two, 38%, season three, 0%.
Also known as the CSOTW (Corpse Sculpture of the Week) Quotient.
Must…resist…doing…this…for…Doctor Who…. must… resist….
I’m surprised you Overthinkers have not prioritised The Shield which would yeild a meaty dataset and, from my memory of the show, conforms to the patterns you’ve hypothesised above.